#P04637, #P19022, #Q16665, #P12004, #P08670, #P06400, #P46527, #P16422, #P12830, #P16070, #P46013, #P08575, #P00533, #P33151, #P08581, #P04626, #P15941, #O15392, #P16284
7157, 1000, 3091, 5111, 7431, 5925, 1027, 4072, 999, 960, 4288, 5788, 1956, 1003, 4233, 2064, 4582, 332, 5175
Product Information
Specificity / Sensitivity
Species Reactivity:
Human
Product Description
Background
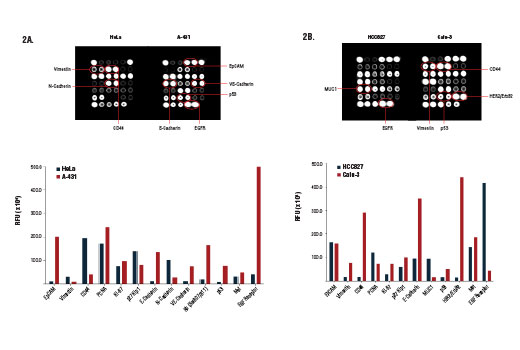
Despite shared hallmarks and common overarching principles, cancers are heterogeneous in nature. Widely used tumor derived cell lines often exhibit both genomic and proteomic differences relative to one another. Factors contributing to these differences include gradual accumulation of genetic lesions within cell lines, transcriptional networks and epigenetic marks remaining from the original tissue, and various adaptations to in vitro culture conditions. Cell lines may differ considerably in the architectural details of basic machineries, the wiring of signal transduction circuitry, and the set points of metabolic pathways. As a result, heterogeneous phenotypes within cell lines will manifest as differences in fundamental cellular functions and a range of behaviors under experimental conditions.
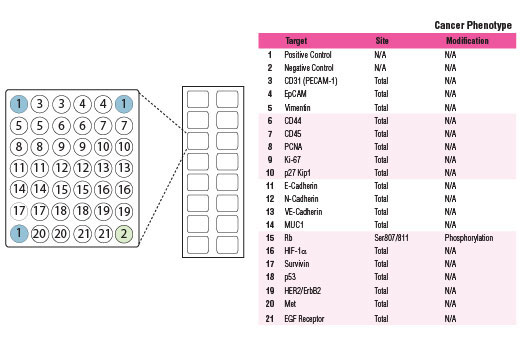
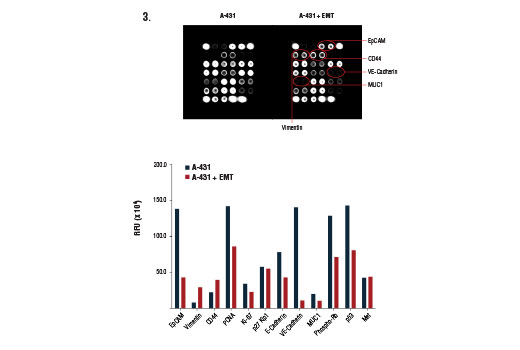
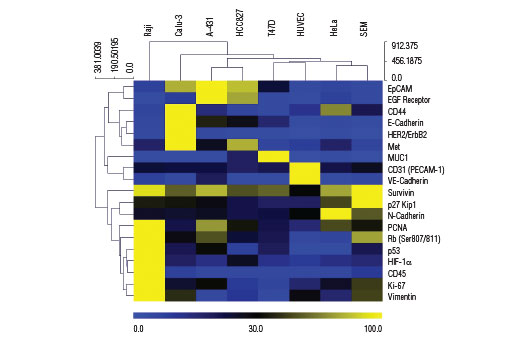
The cell surface represents a compartment where a high level of heterogeneity is displayed. Cancer cells can use the wide array of cell surface proteins to sense, attract, and respond to survival or growth factors in order to promote cancer cell proliferation and growth. Certain cell surface molecules can shield cancer cells from the immune response, help to procure nutrients and create more favorable conditions, and provide a means for the spread and colonization of the cancer cells to other tissues. The presence (or absence) of specific cellular proteins can be regarded as a characteristic phenotypic trait that allows for the classification of cancer cell type and may help predict cellular response to specific experimental conditions both in vitro and in vivo.
Understanding and modeling tumor cell behavior, sensitivity and resistance to various drugs, identification of oncogene dependencies and network vulnerabilities requires a systems-level measurement of multiple parameters. Therefore, it is important to simultaneously survey both the cell surface as well as key molecules that serve as indicators for cell cycle progression, epithelial to mesenchymal transition, and activation of the hypoxic response program.
- Scheel, C. and Weinberg, R.A. (2012) Semin Cancer Biol 22, 396-403.
- Hale, J.S. et al. (2012) Cell Adh Migr 6, 346-55.
- Varga, J. et al. (2014) FEBS Lett 588, 2422-7.
- Zöller, M. (2011) Nat Rev Cancer 11, 254-67.
- van Roy, F. (2014) Nat Rev Cancer 14, 121-34.
- Schnell, U. et al. (2013) Biochim Biophys Acta 1828, 1989-2001.
- Kufe, D.W. (2013) Oncogene 32, 1073-81.
Species Reactivity
Species reactivity is determined by testing in at least one approved application (e.g., western blot).
Cross-Reactivity Key
H: human M: mouse R: rat Hm: hamster Mk: monkey Vir: virus Mi: mink C: chicken Dm: D. melanogaster X: Xenopus Z: zebrafish B: bovine Dg: dog Pg: pig Sc: S. cerevisiae Ce: C. elegans Hr: horse GP: Guinea Pig Rab: rabbit All: all species expected
Trademarks and Patents
使用に関する制限
法的な権限を与えられたCSTの担当者が署名した書面によって別途明示的に合意された場合を除き、 CST、その関連会社または代理店が提供する製品には以下の条件が適用されます。お客様が定める条件でここに定められた条件に含まれるものを超えるもの、 または、ここに定められた条件と異なるものは、法的な権限を与えられたCSTの担当者が別途書面にて受諾した場合を除き、拒絶され、 いかなる効力も効果も有しません。
研究専用 (For Research Use Only) またはこれに類似する表示がされた製品は、 いかなる目的についても FDA または外国もしくは国内のその他の規制機関により承認、認可または許可を受けていません。 お客様は製品を診断もしくは治療目的で使用してはならず、また、製品に表示された内容に違反する方法で使用してはなりません。 CST が販売または使用許諾する製品は、エンドユーザーであるお客様に対し、使途を研究および開発のみに限定して提供されるものです。 診断、予防もしくは治療目的で製品を使用することまたは製品を再販売 (単独であるか他の製品等の一部であるかを問いません) もしくはその他の商業的利用の目的で購入することについては、CST から別途許諾を得る必要があります。 お客様は以下の事項を遵守しなければなりません。(a) CST の製品 (単独であるか他の資材と一緒であるかを問いません) を販売、使用許諾、貸与、寄付もしくはその他の態様で第三者に譲渡したり使用させたりしてはなりません。また、商用の製品を製造するために CST の製品を使用してはなりません。(b) 複製、改変、リバースエンジニアリング、逆コンパイル、 分解または他の方法により製品の構造または技術を解明しようとしてはなりません。また、 CST の製品またはサービスと競合する製品またはサービスを開発する目的で CST の製品を使用してはなりません。(c) CST の製品の商標、商号、ロゴ、特許または著作権に関する通知または表示を除去したり改変したりしてはなりません。(d) CST の製品をCST 製品販売条件(CST’s Product Terms of Sale) および該当する書面のみに従って使用しなければなりません。(e) CST の製品に関連してお客様が使用する第三者の製品またはサービスに関する使用許諾条件、 サービス提供条件またはこれに類する合意事項を遵守しなければなりません。