| Product Includes | Product # | Quantity | Mol. Wt | Isotype/Source |
|---|---|---|---|---|
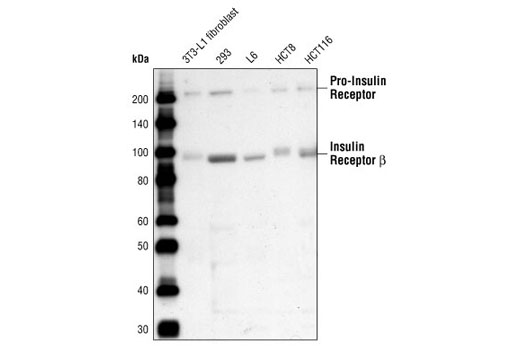
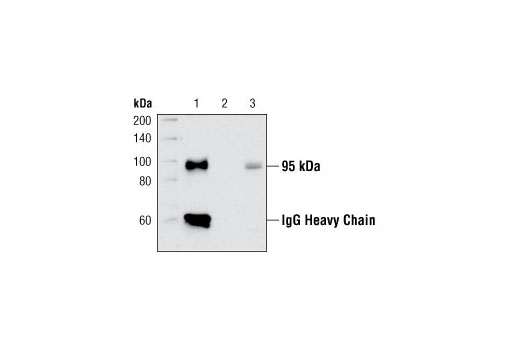
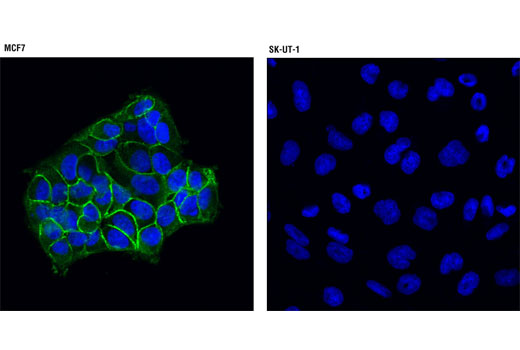
| Insulin Receptor β (4B8) Rabbit mAb | 3025 | 20 µl | 95 kDa | Rabbit IgG |
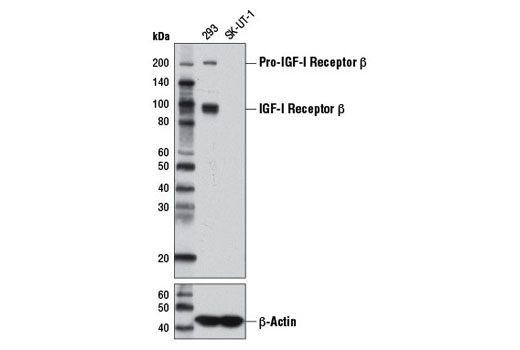
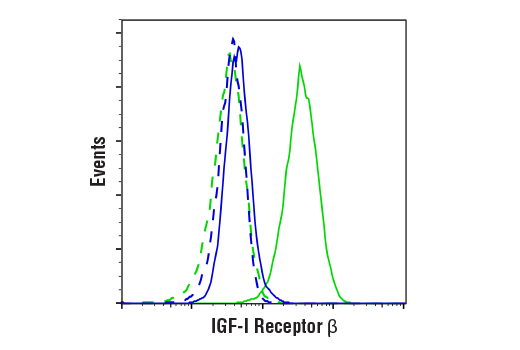
| IGF-I Receptor β (D23H3) XP® Rabbit mAb | 9750 | 20 µl | 95 kDa | Rabbit IgG |
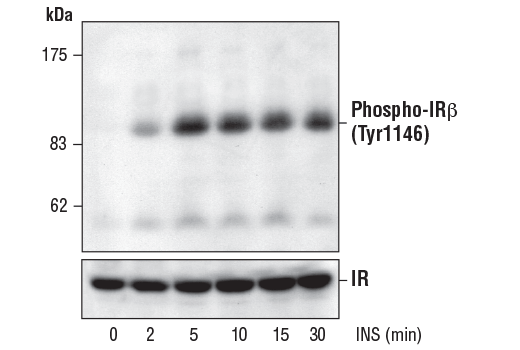
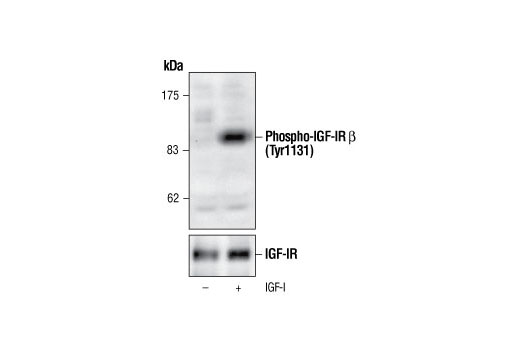
| Phospho-IGF-I Receptor β (Tyr1131)/Insulin Receptor β (Tyr1146) Antibody | 3021 | 20 µl | 95 kDa | Rabbit |
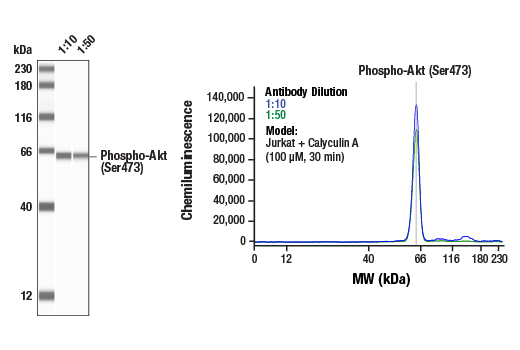
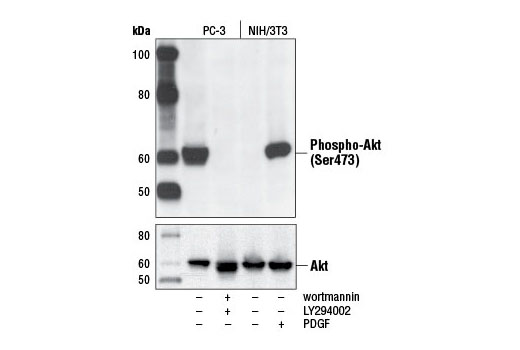
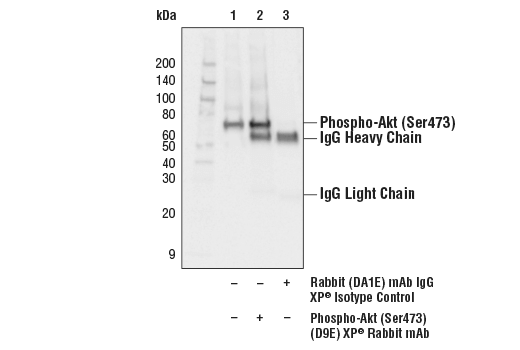
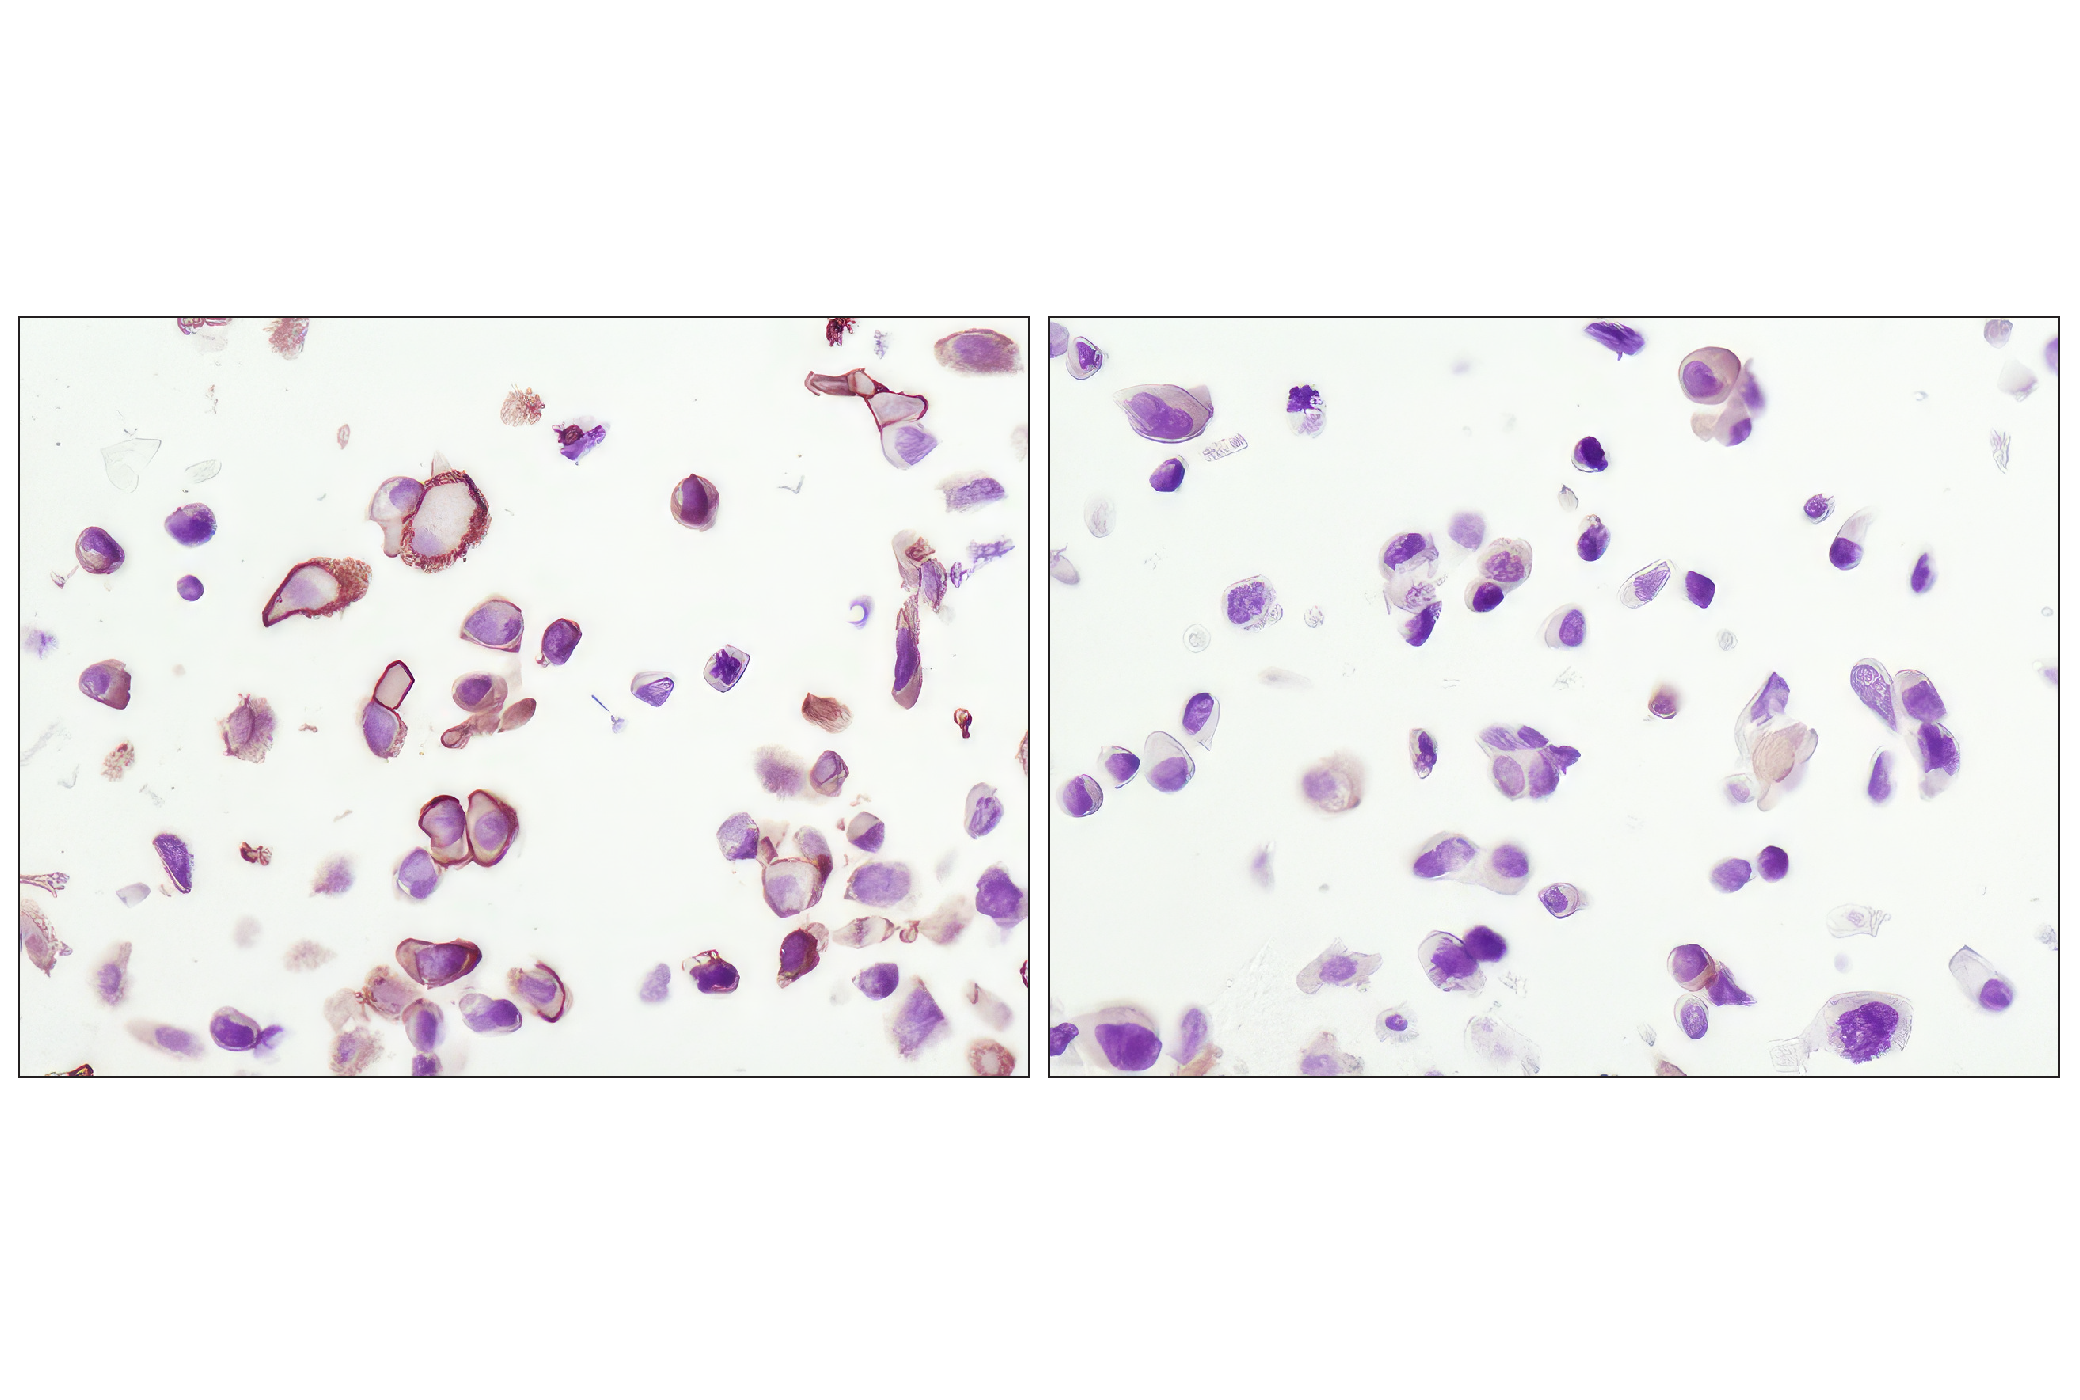
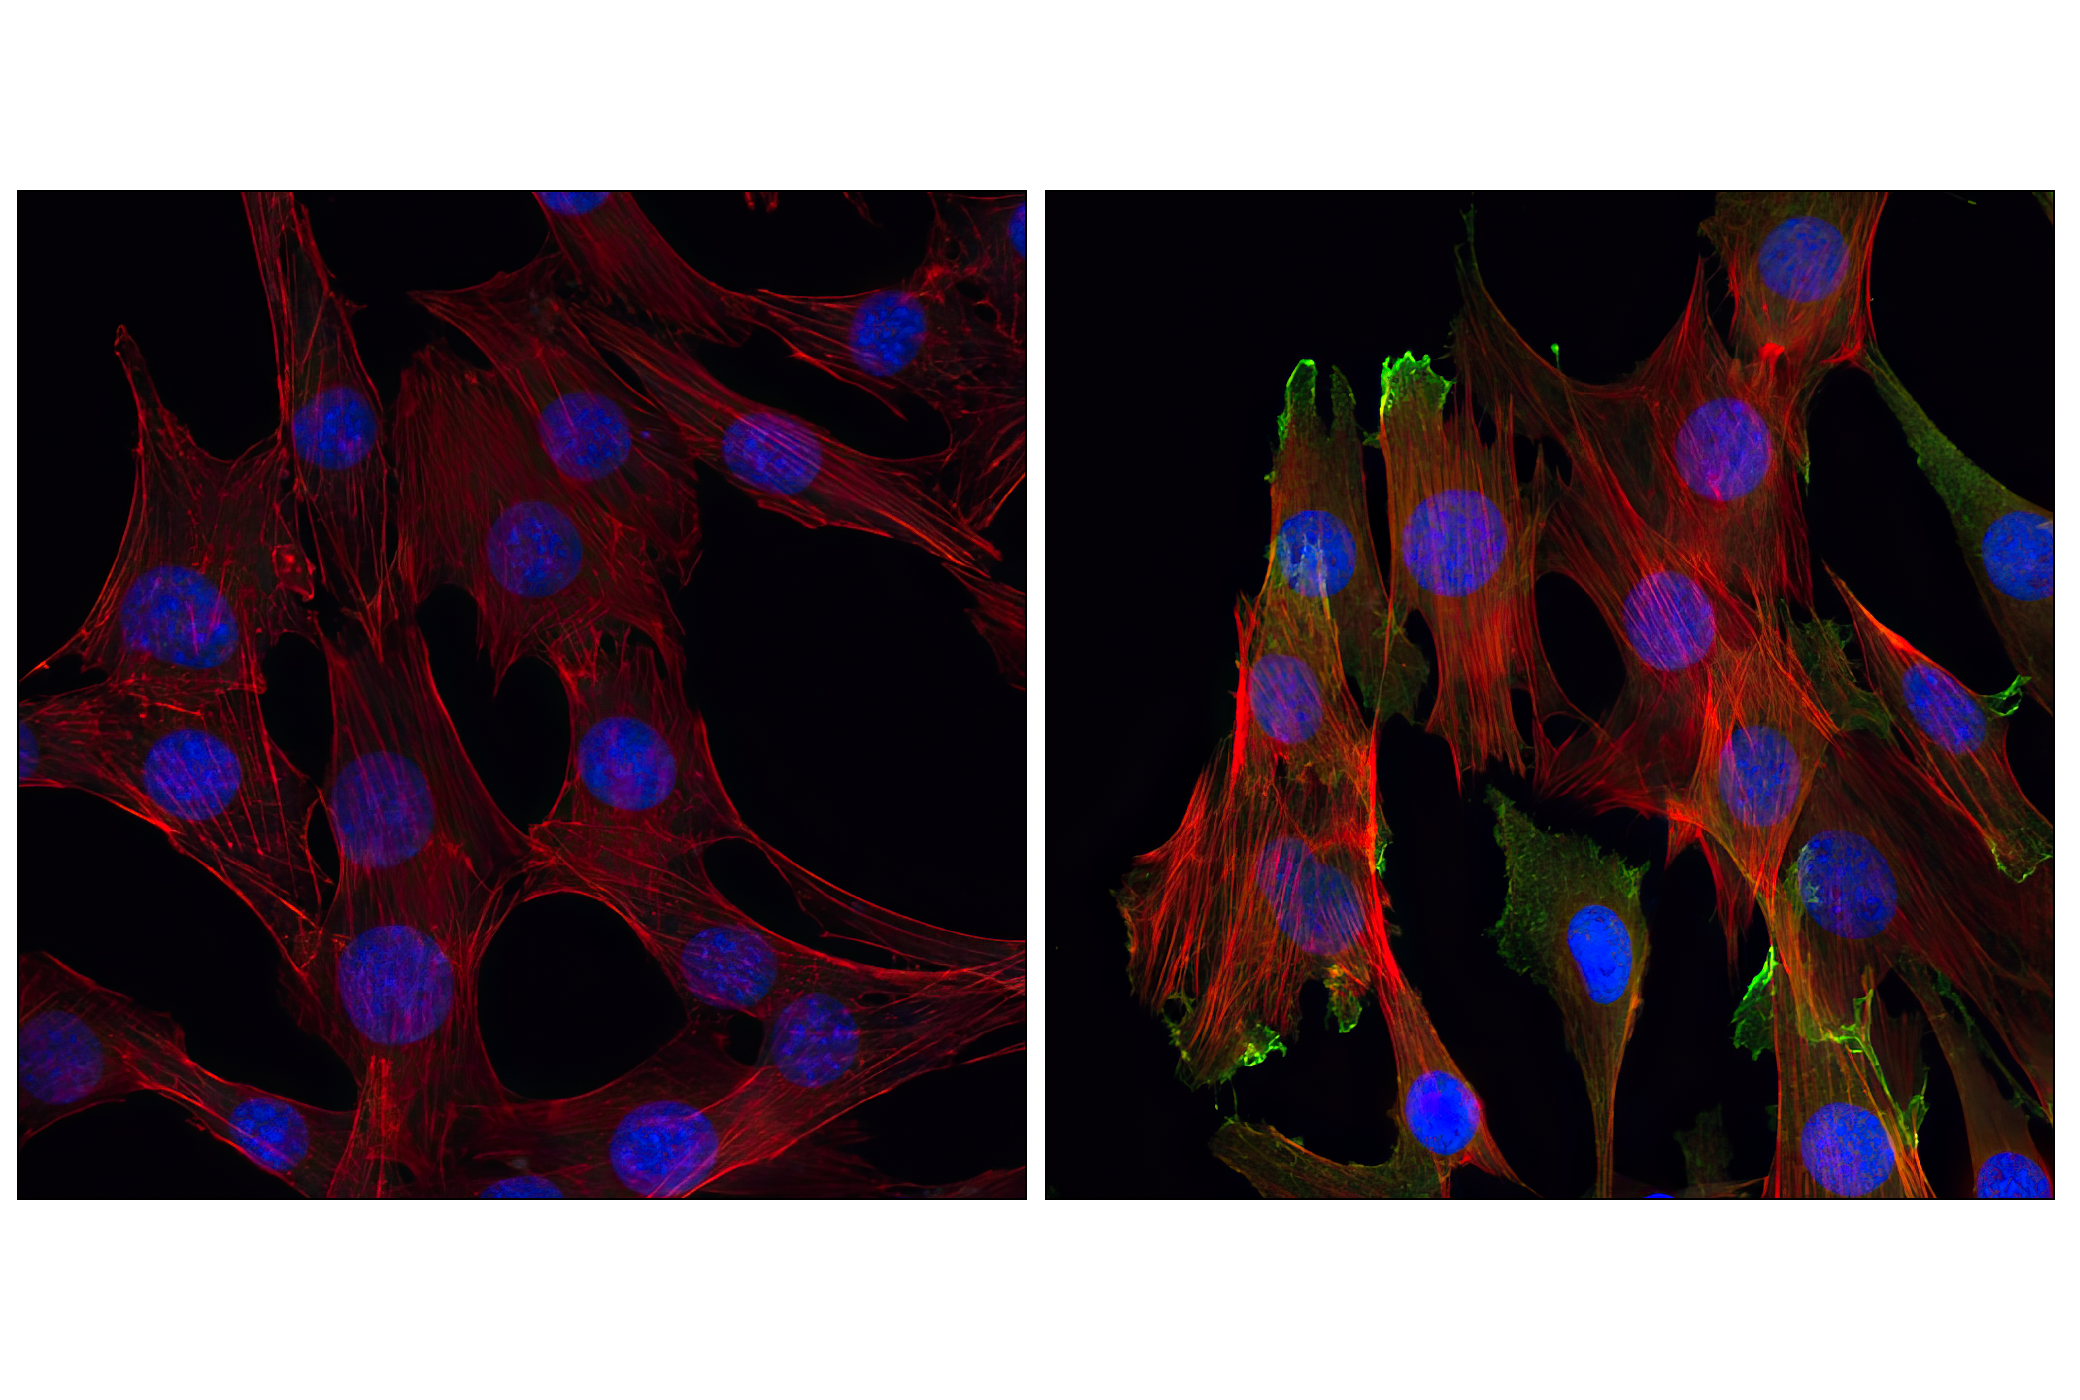
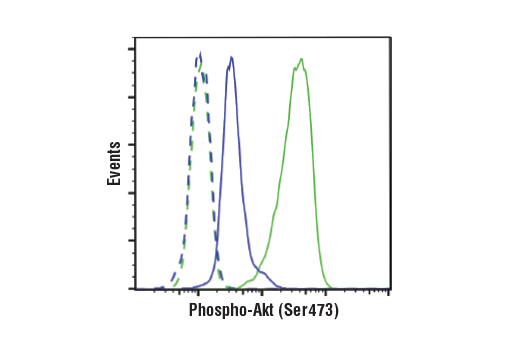
| Phospho-Akt (Ser473) (D9E) XP® Rabbit mAb | 4060 | 20 µl | 60 kDa | Rabbit IgG |
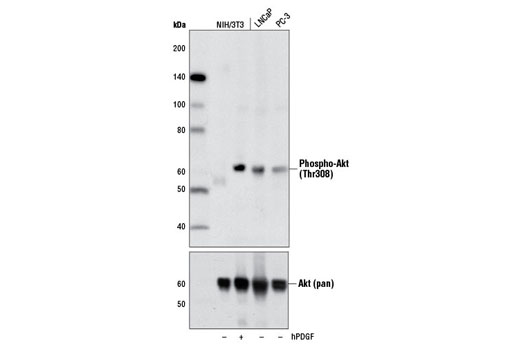
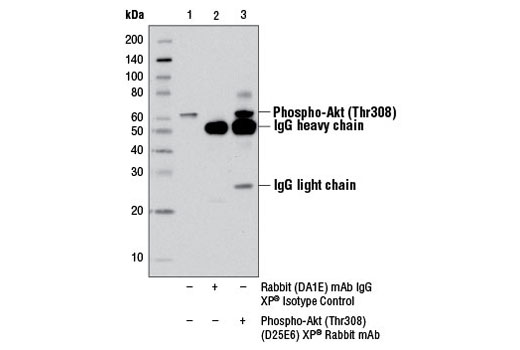
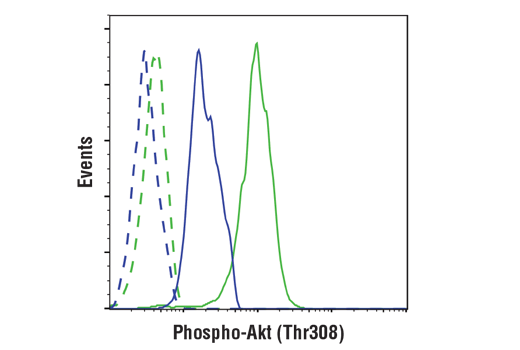
| Phospho-Akt (Thr308) (D25E6) XP® Rabbit mAb | 13038 | 20 µl | 60 kDa | Rabbit IgG |
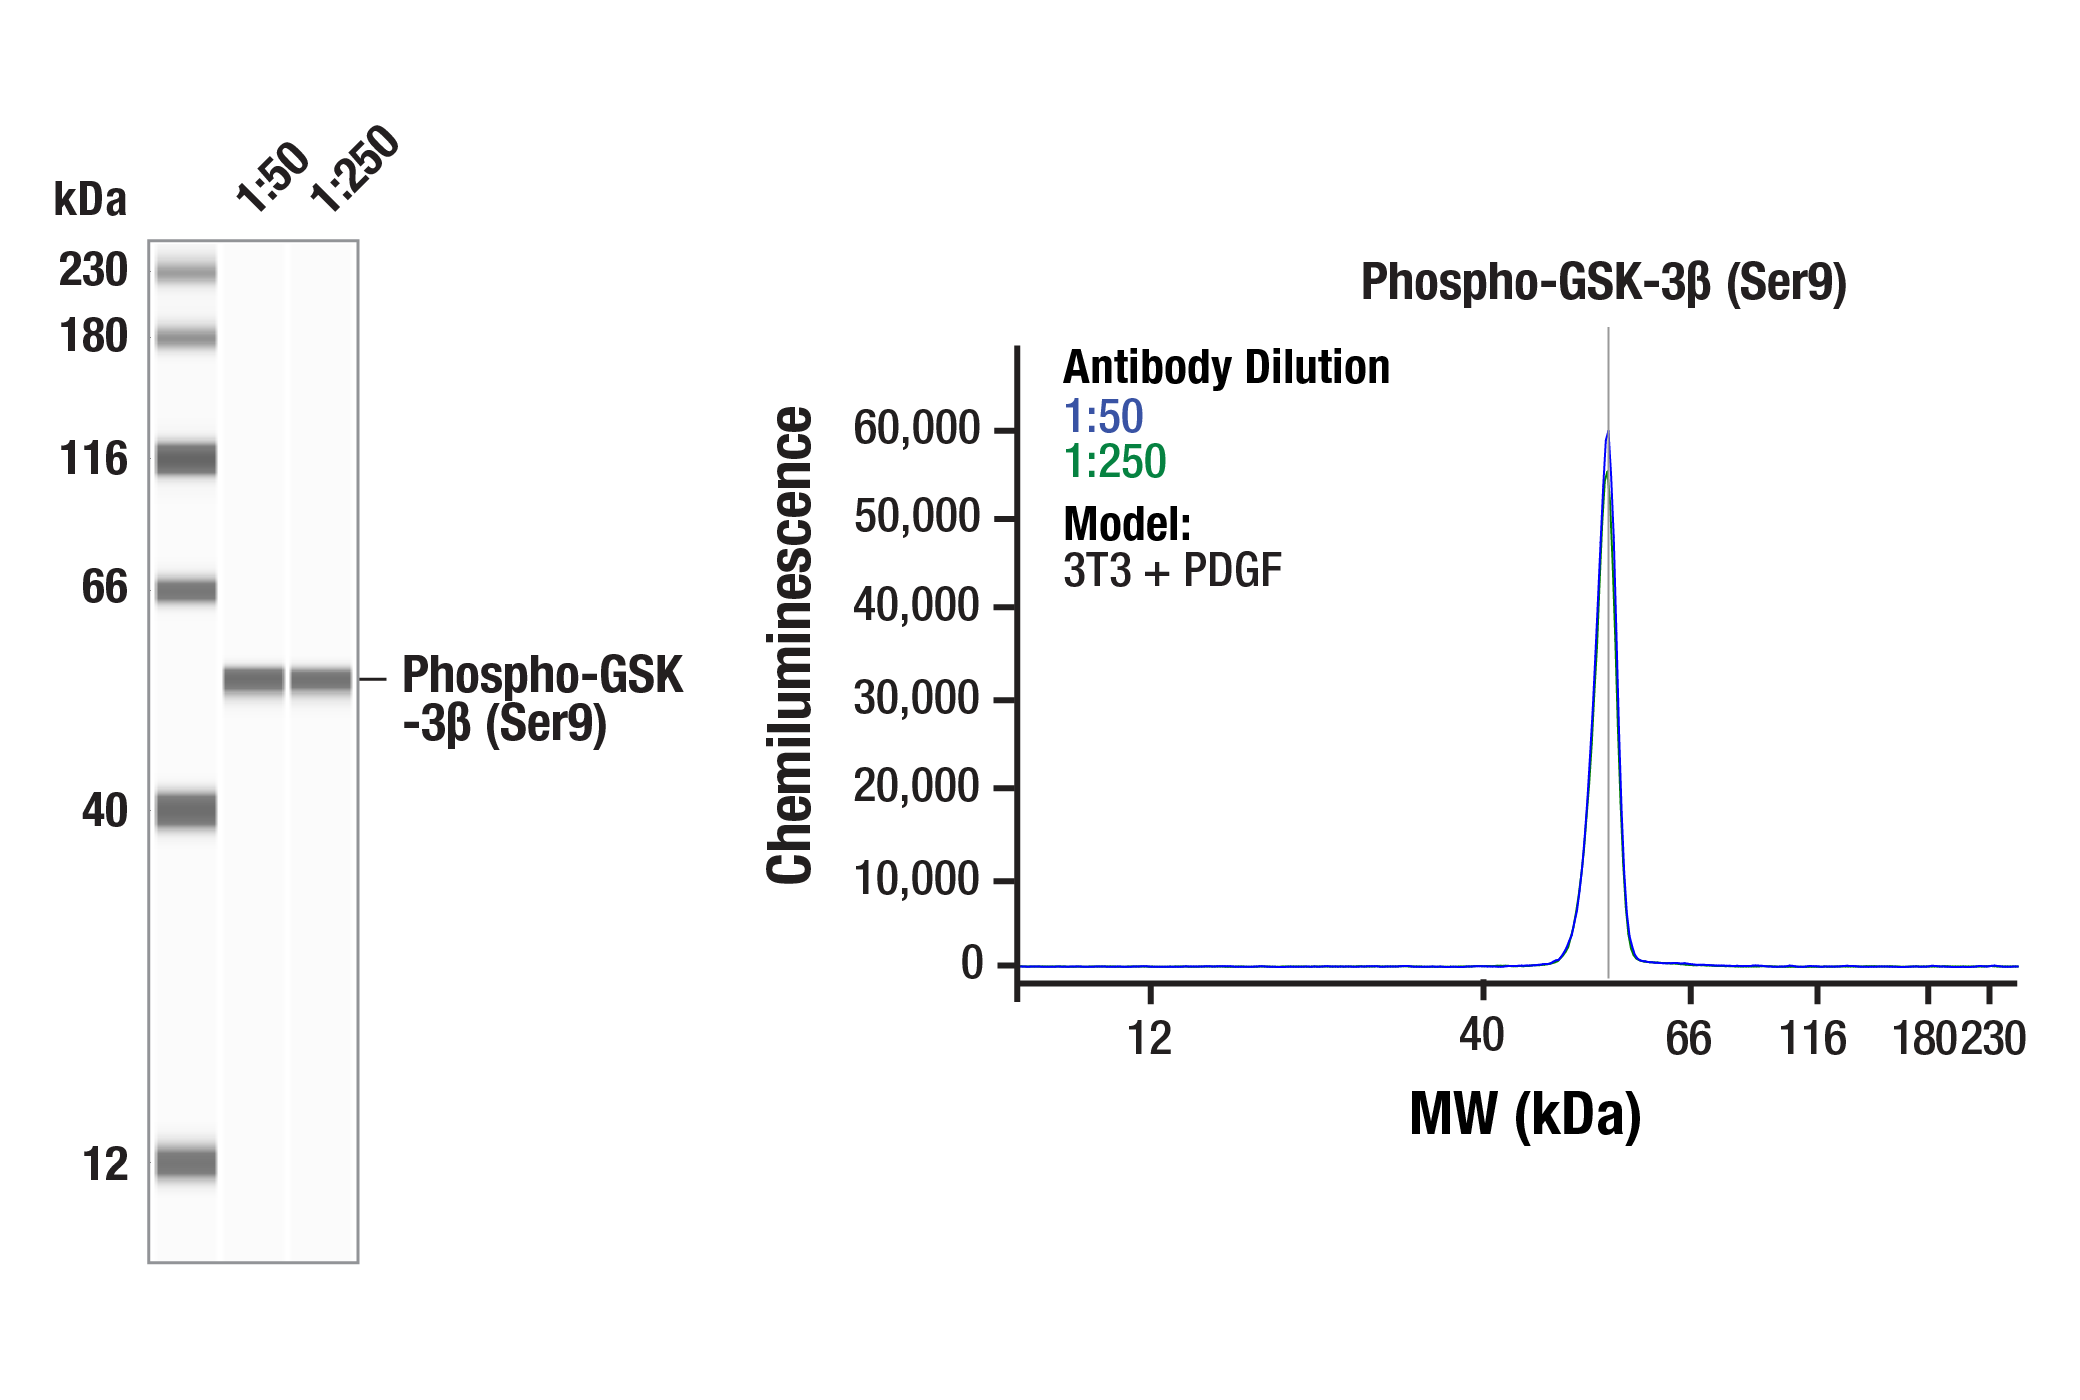
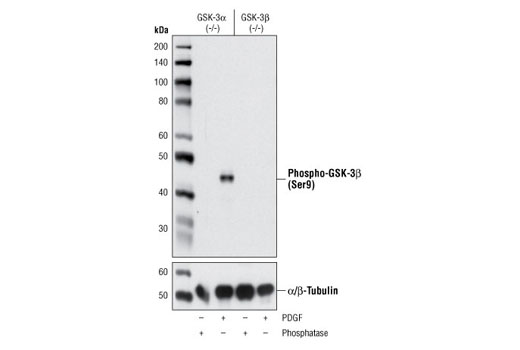
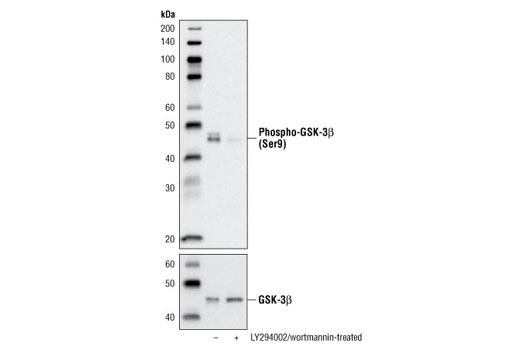
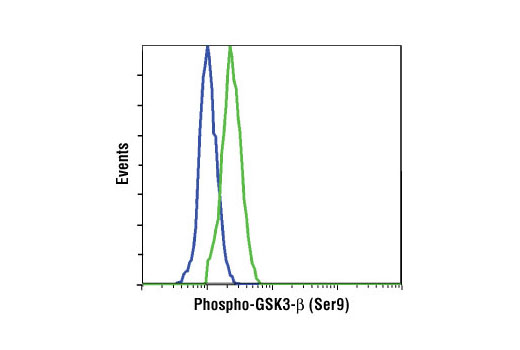
| Phospho-GSK-3β (Ser9) (D85E12) XP® Rabbit mAb | 5558 | 20 µl | 46 kDa | Rabbit IgG |
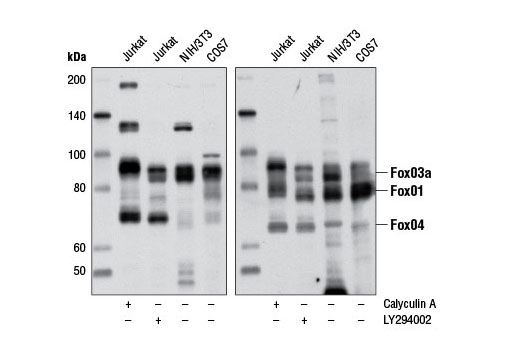
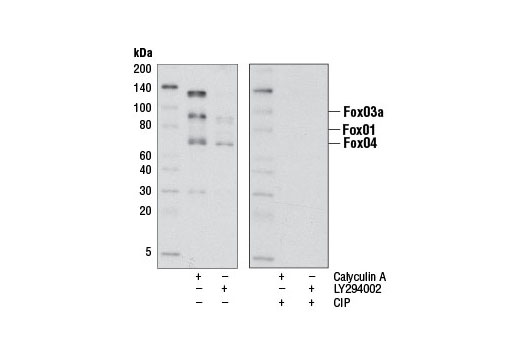
| Phospho-FoxO1 (Thr24)/FoxO3a (Thr32)/FoxO4 (Thr28) (4G6) Rabbit mAb | 2599 | 20 µl | 65, 78 to 82, 95 kDa | Rabbit |
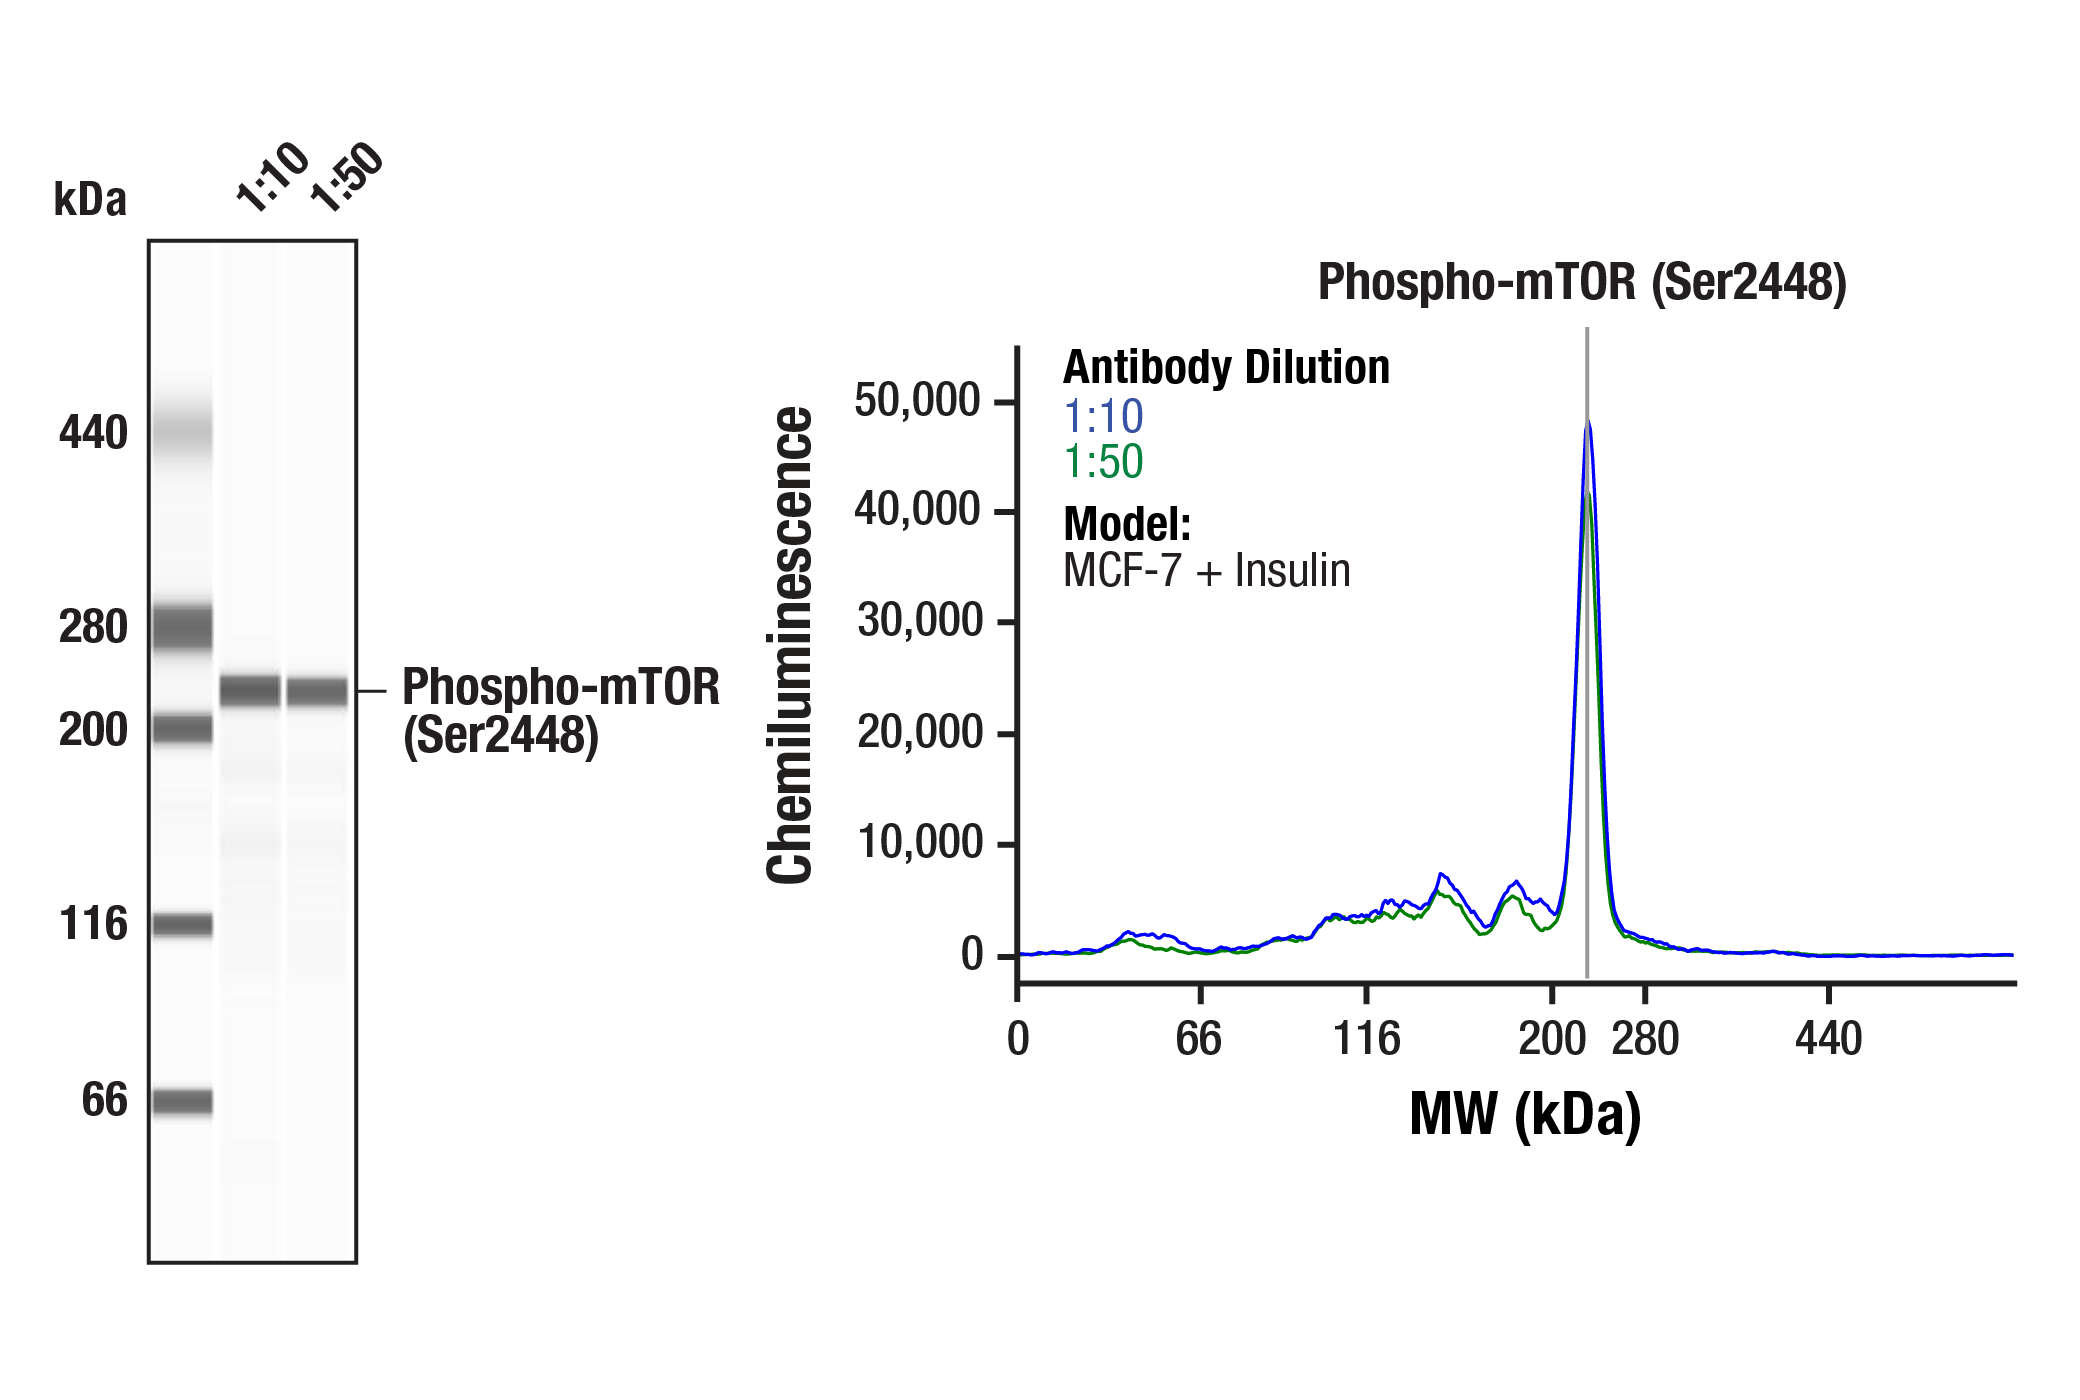
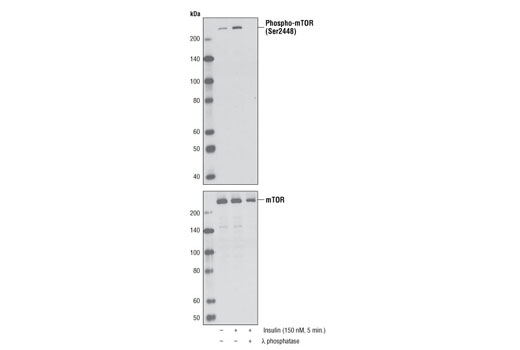
| Phospho-mTOR (Ser2448) (D9C2) XP® Rabbit mAb | 5536 | 20 µl | 289 kDa | Rabbit IgG |
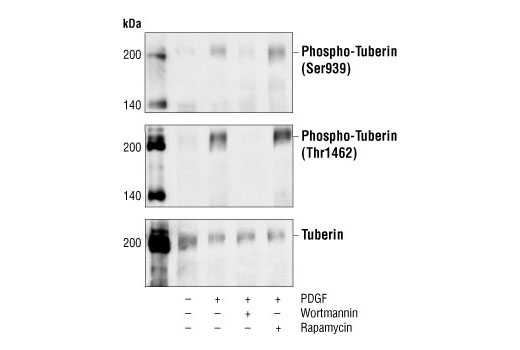
| Phospho-Tuberin/TSC2 (Ser939) Antibody | 3615 | 20 µl | 200 kDa | Rabbit |
| Anti-rabbit IgG, HRP-linked Antibody | 7074 | 100 µl | Goat |
Please visit cellsignal.com for individual component applications, species cross-reactivity, dilutions, protocols, and additional product information.
Description
The Insulin/IGF-1 Signaling Pathway Antibody Sampler Kit provides an economical means of detecting select components involved in the insulin and/or IGF-1 signaling pathways. The kit contains enough primary antibodies to perform at least two western blot experiments per antibody.
Storage
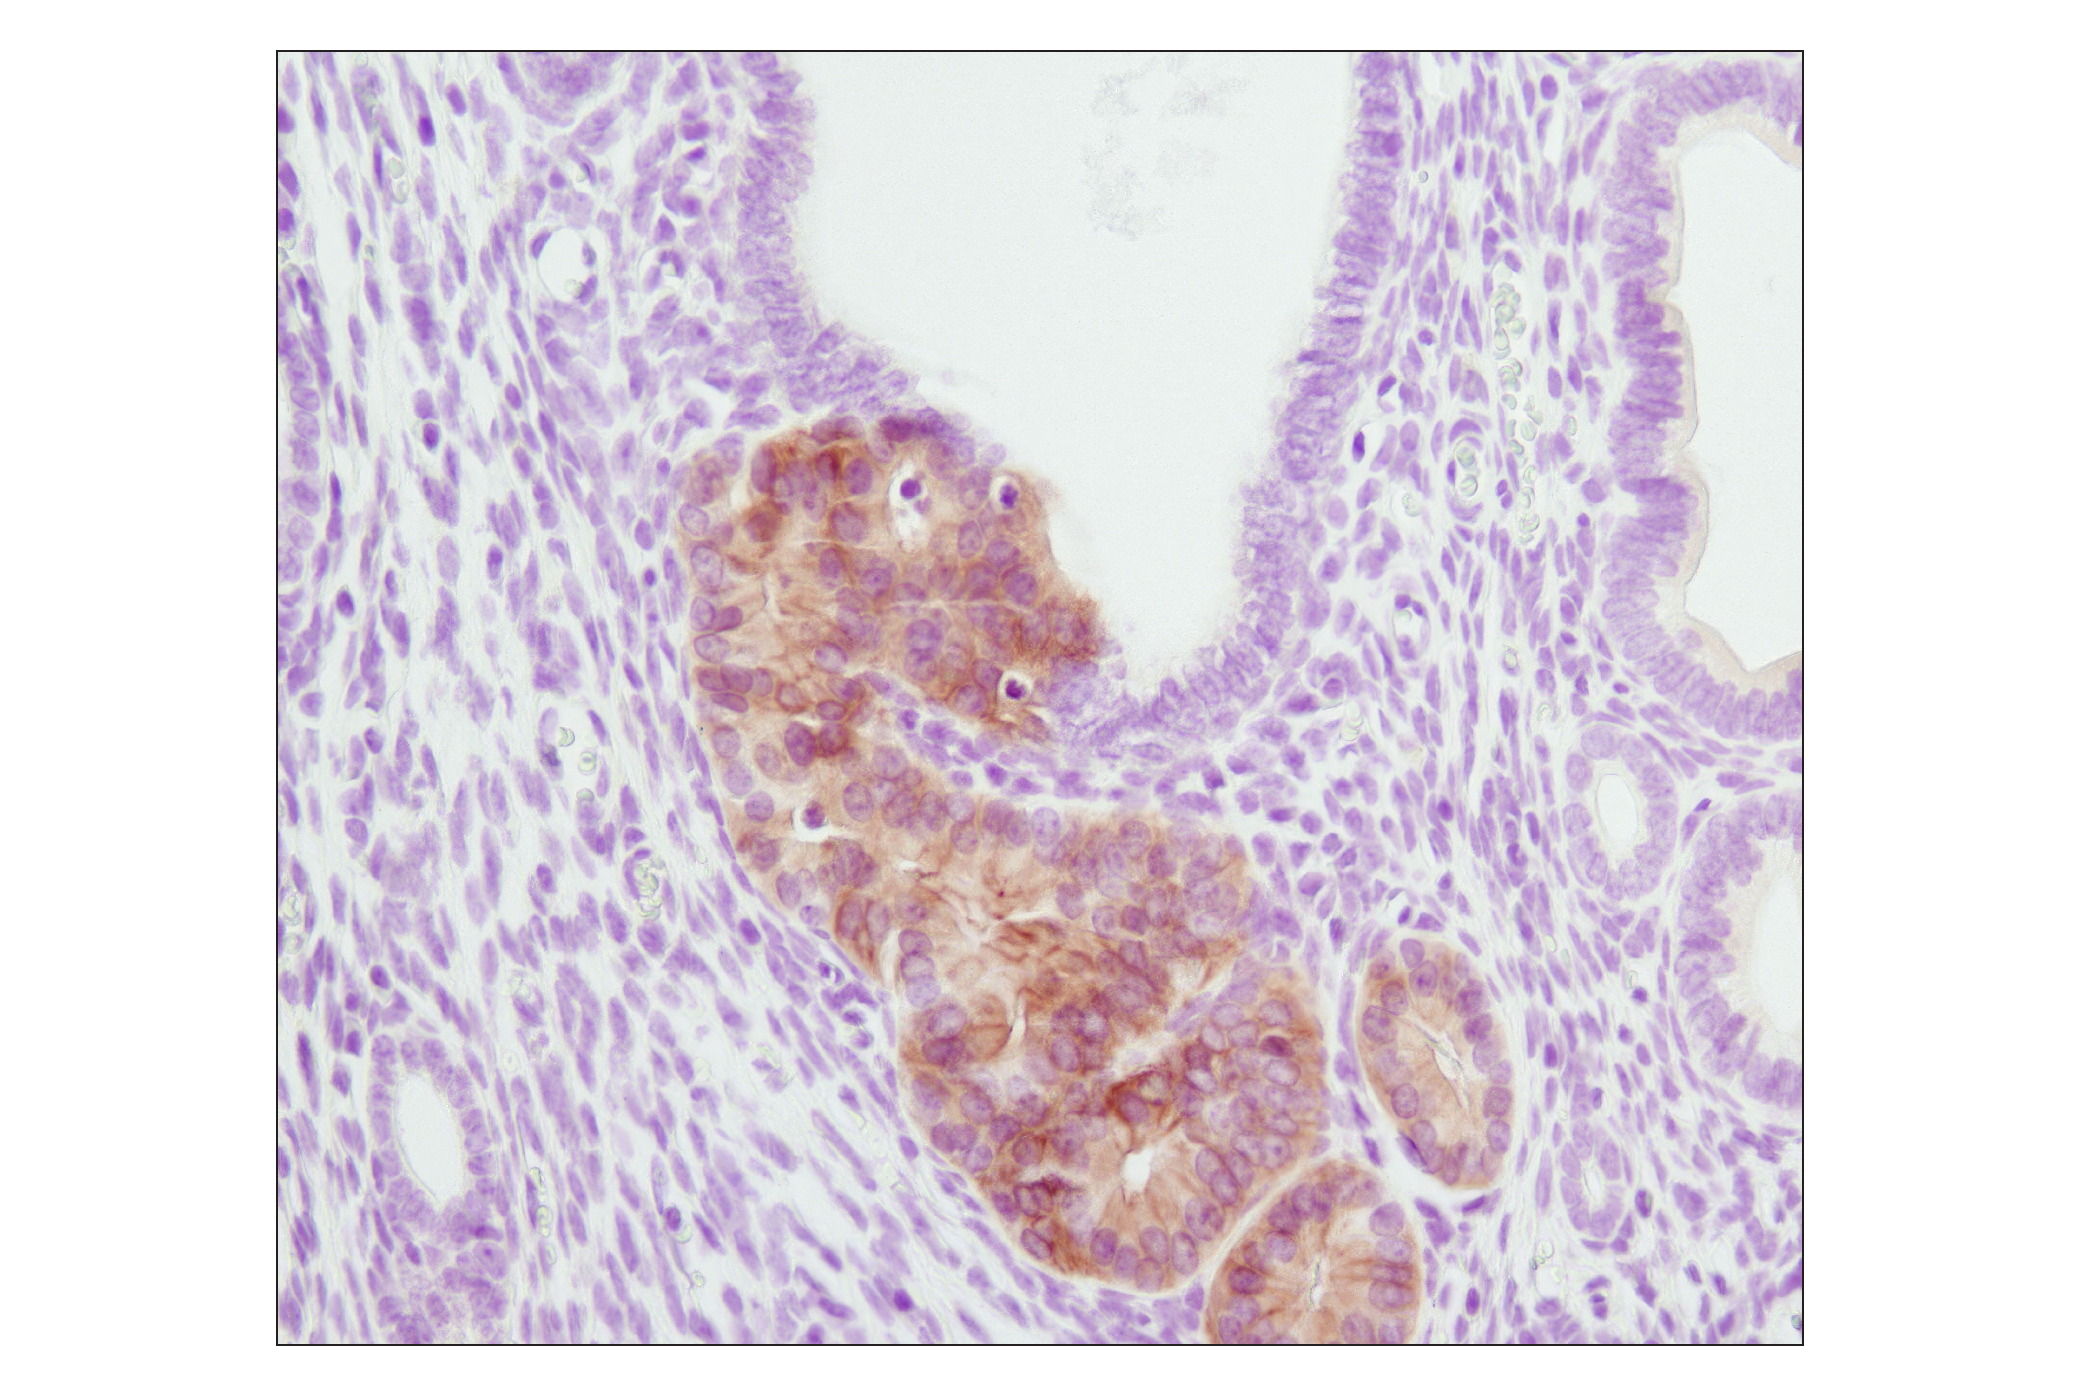
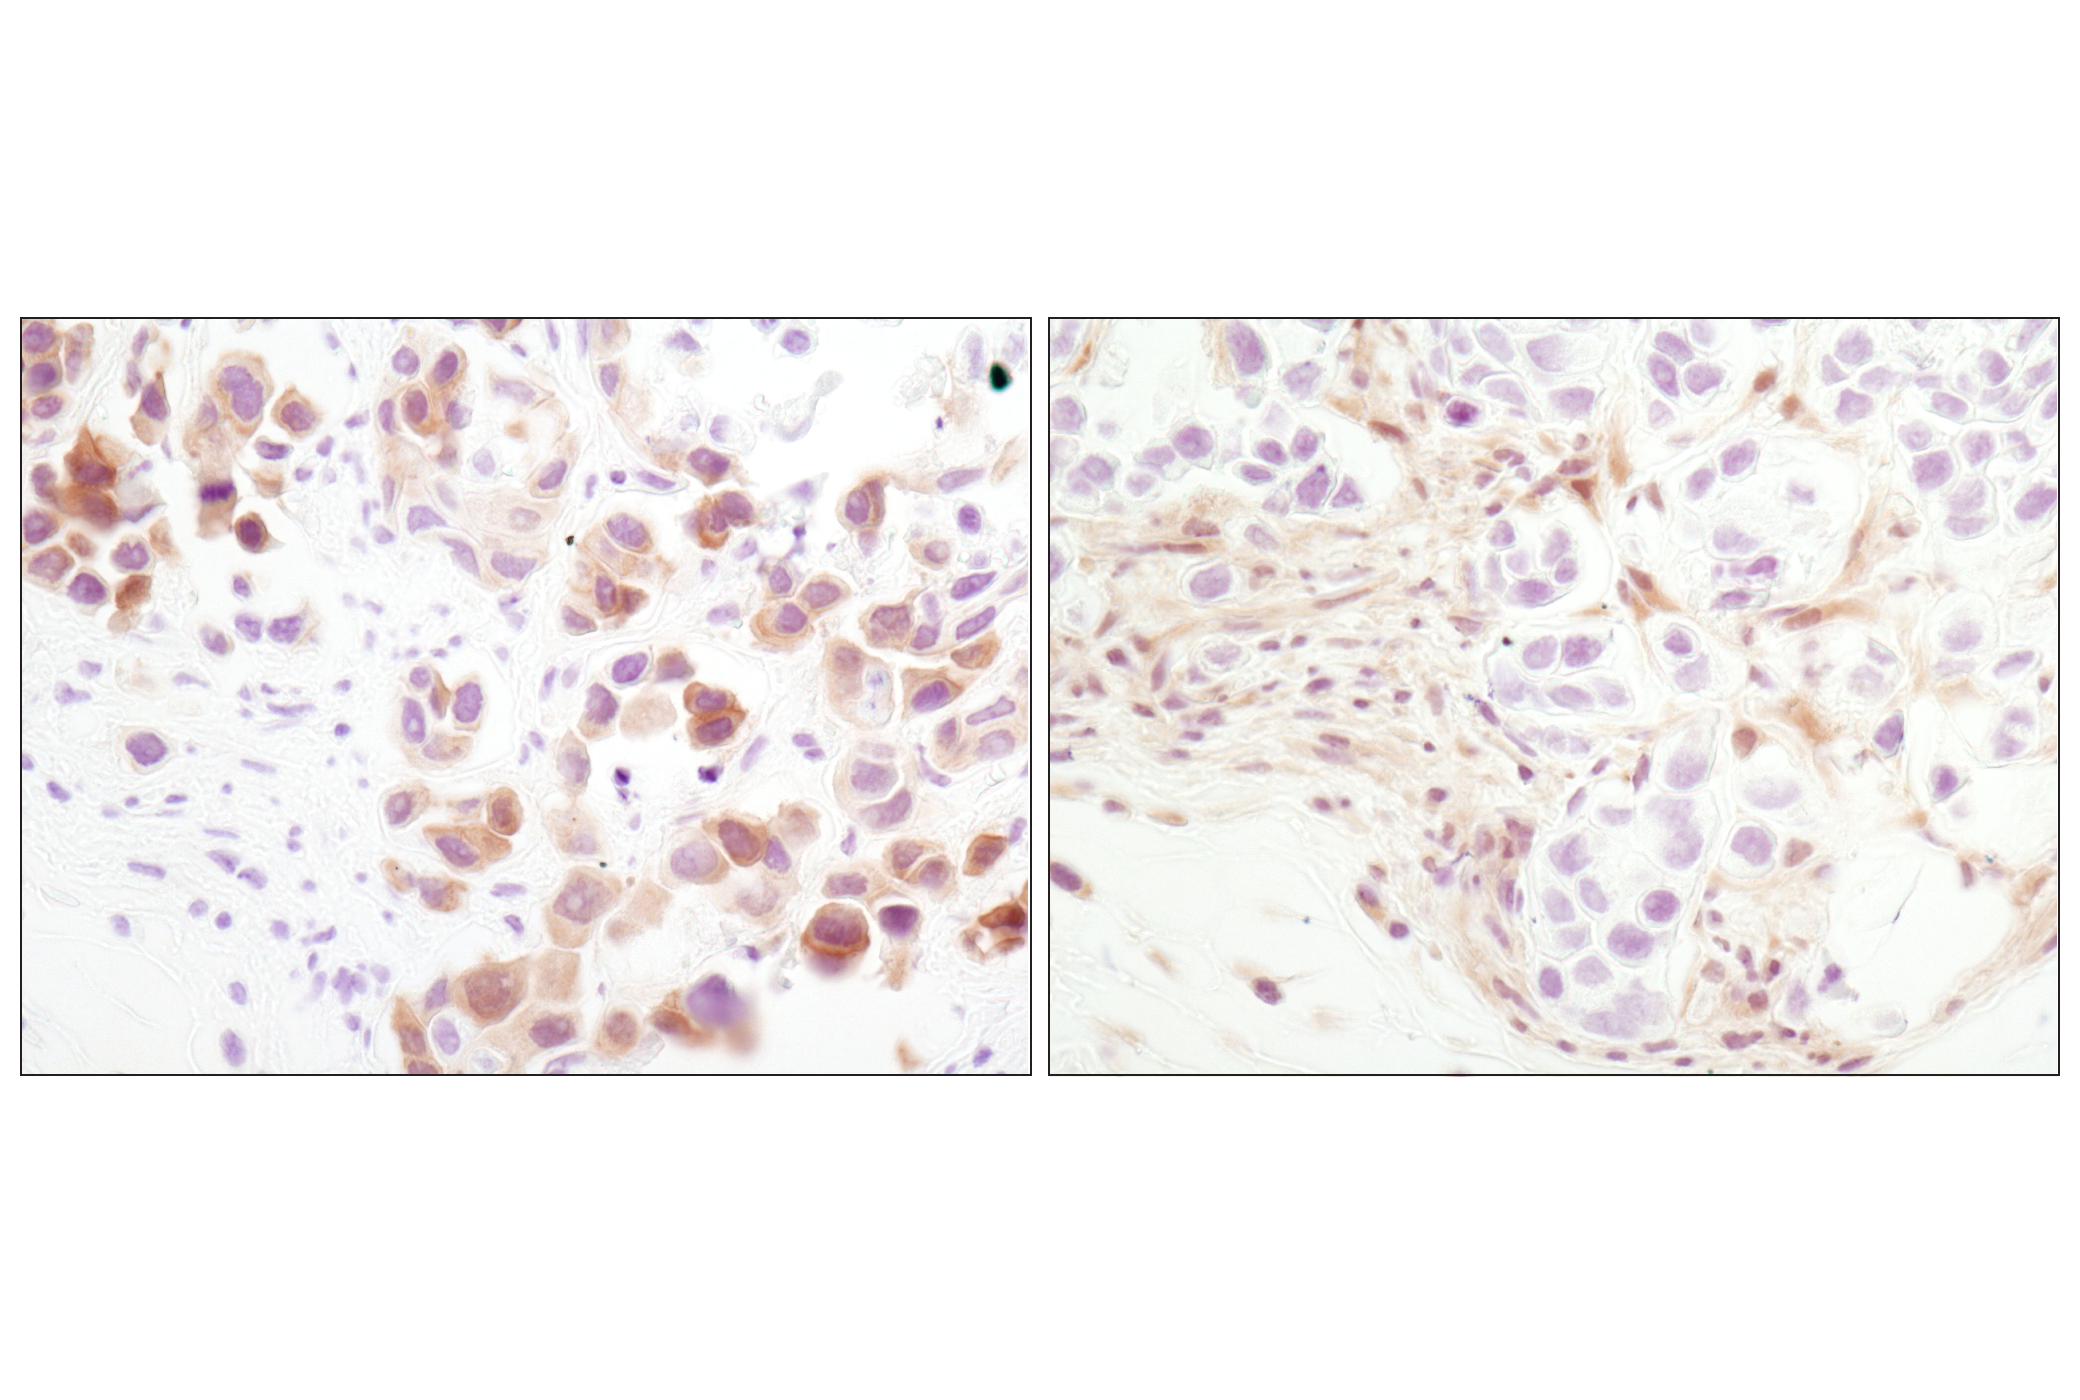
Background
Insulin and IGF-1 act on two closely related tyrosine kinase receptors to initiate a cascade of signaling events. These signaling events activate a variety of biological molecules, including kinases and transcription factors, which regulate cell growth, survival and metabolism.
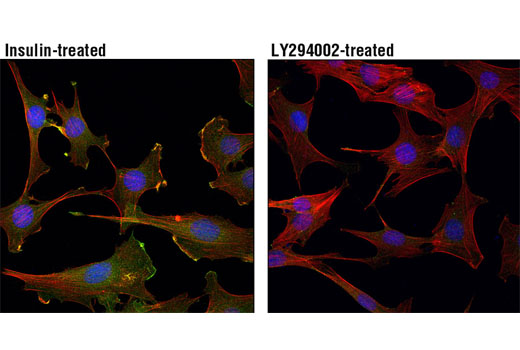
Type I insulin-like growth factor receptor (IGF-IR) is a transmembrane receptor tyrosine kinase that is widely expressed in many cell lines and cell types within fetal and postnatal tissues (1-3). Three tyrosine residues within the kinase domain (Tyr1131, Tyr1135, and Tyr1136) are the earliest major autophosphorylation sites (4). Phosphorylation of these three tyrosine residues is necessary for kinase activation (5,6). Insulin receptors (IRs) share significant structural and functional similarity with IGF-I receptors, including the presence of an equivalent tyrosine cluster (Tyr1146/1150/1151) within the kinase domain activation loop. Tyrosine autophosphorylation of IRs is one of the earliest cellular responses to insulin stimulation (7). Autophosphorylation begins with phosphorylation at Tyr1146 and either Tyr1150 or Tyr1151, while full kinase activation requires triple tyrosine phosphorylation (8).
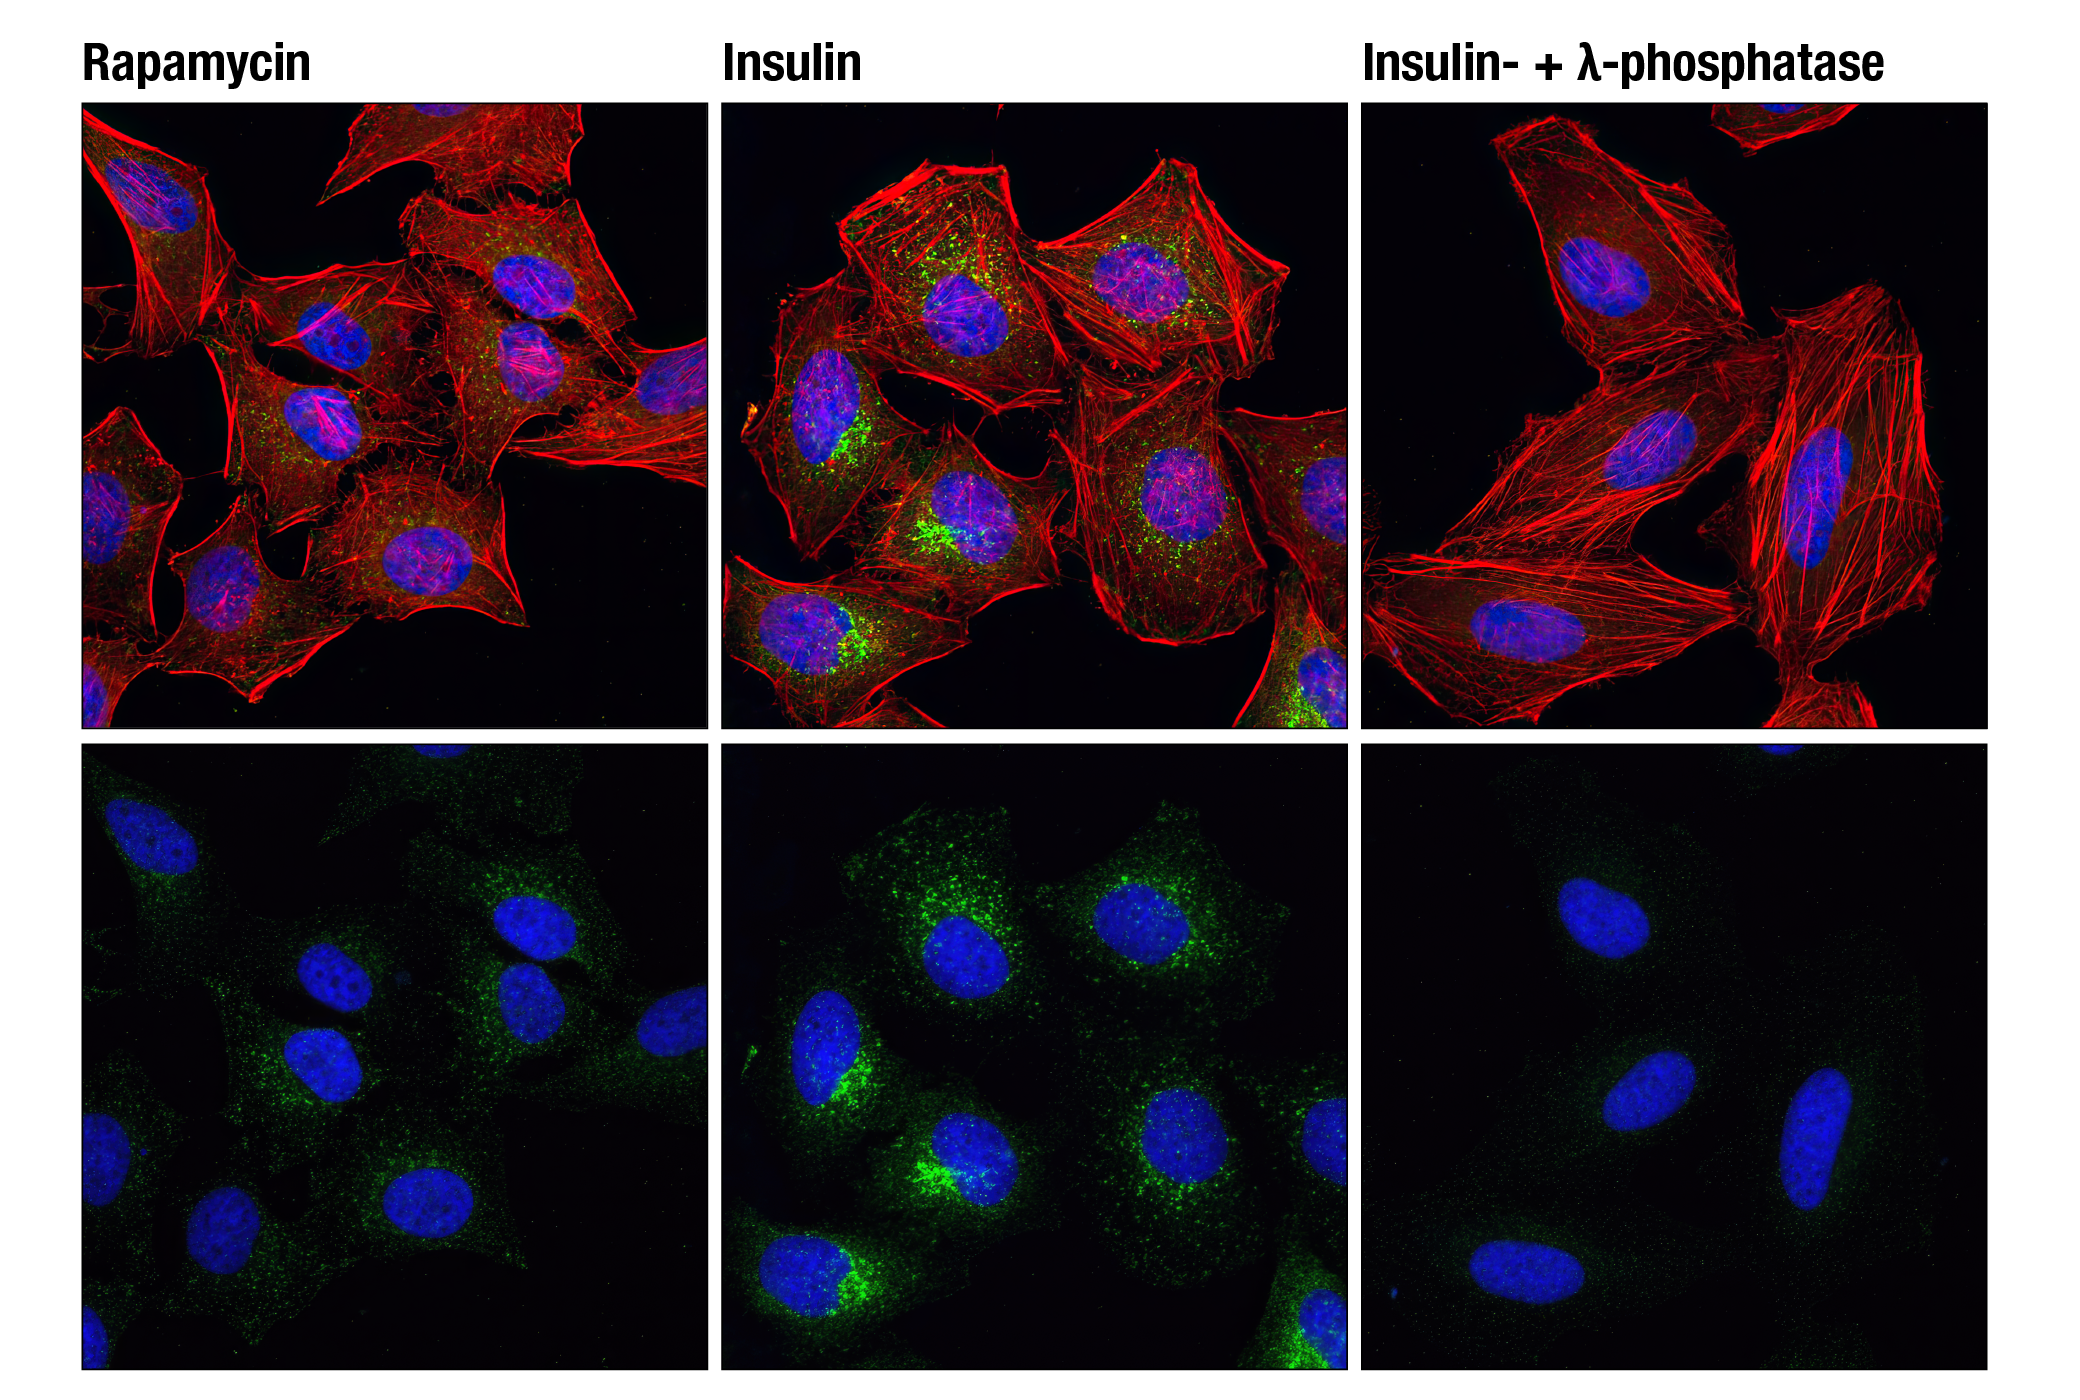
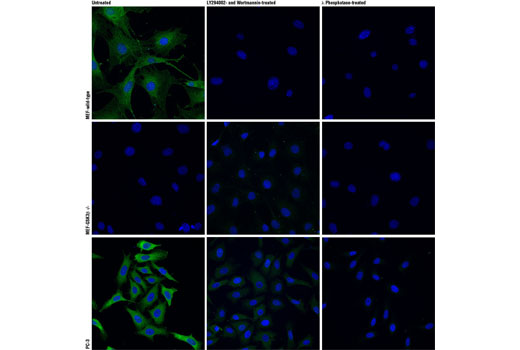
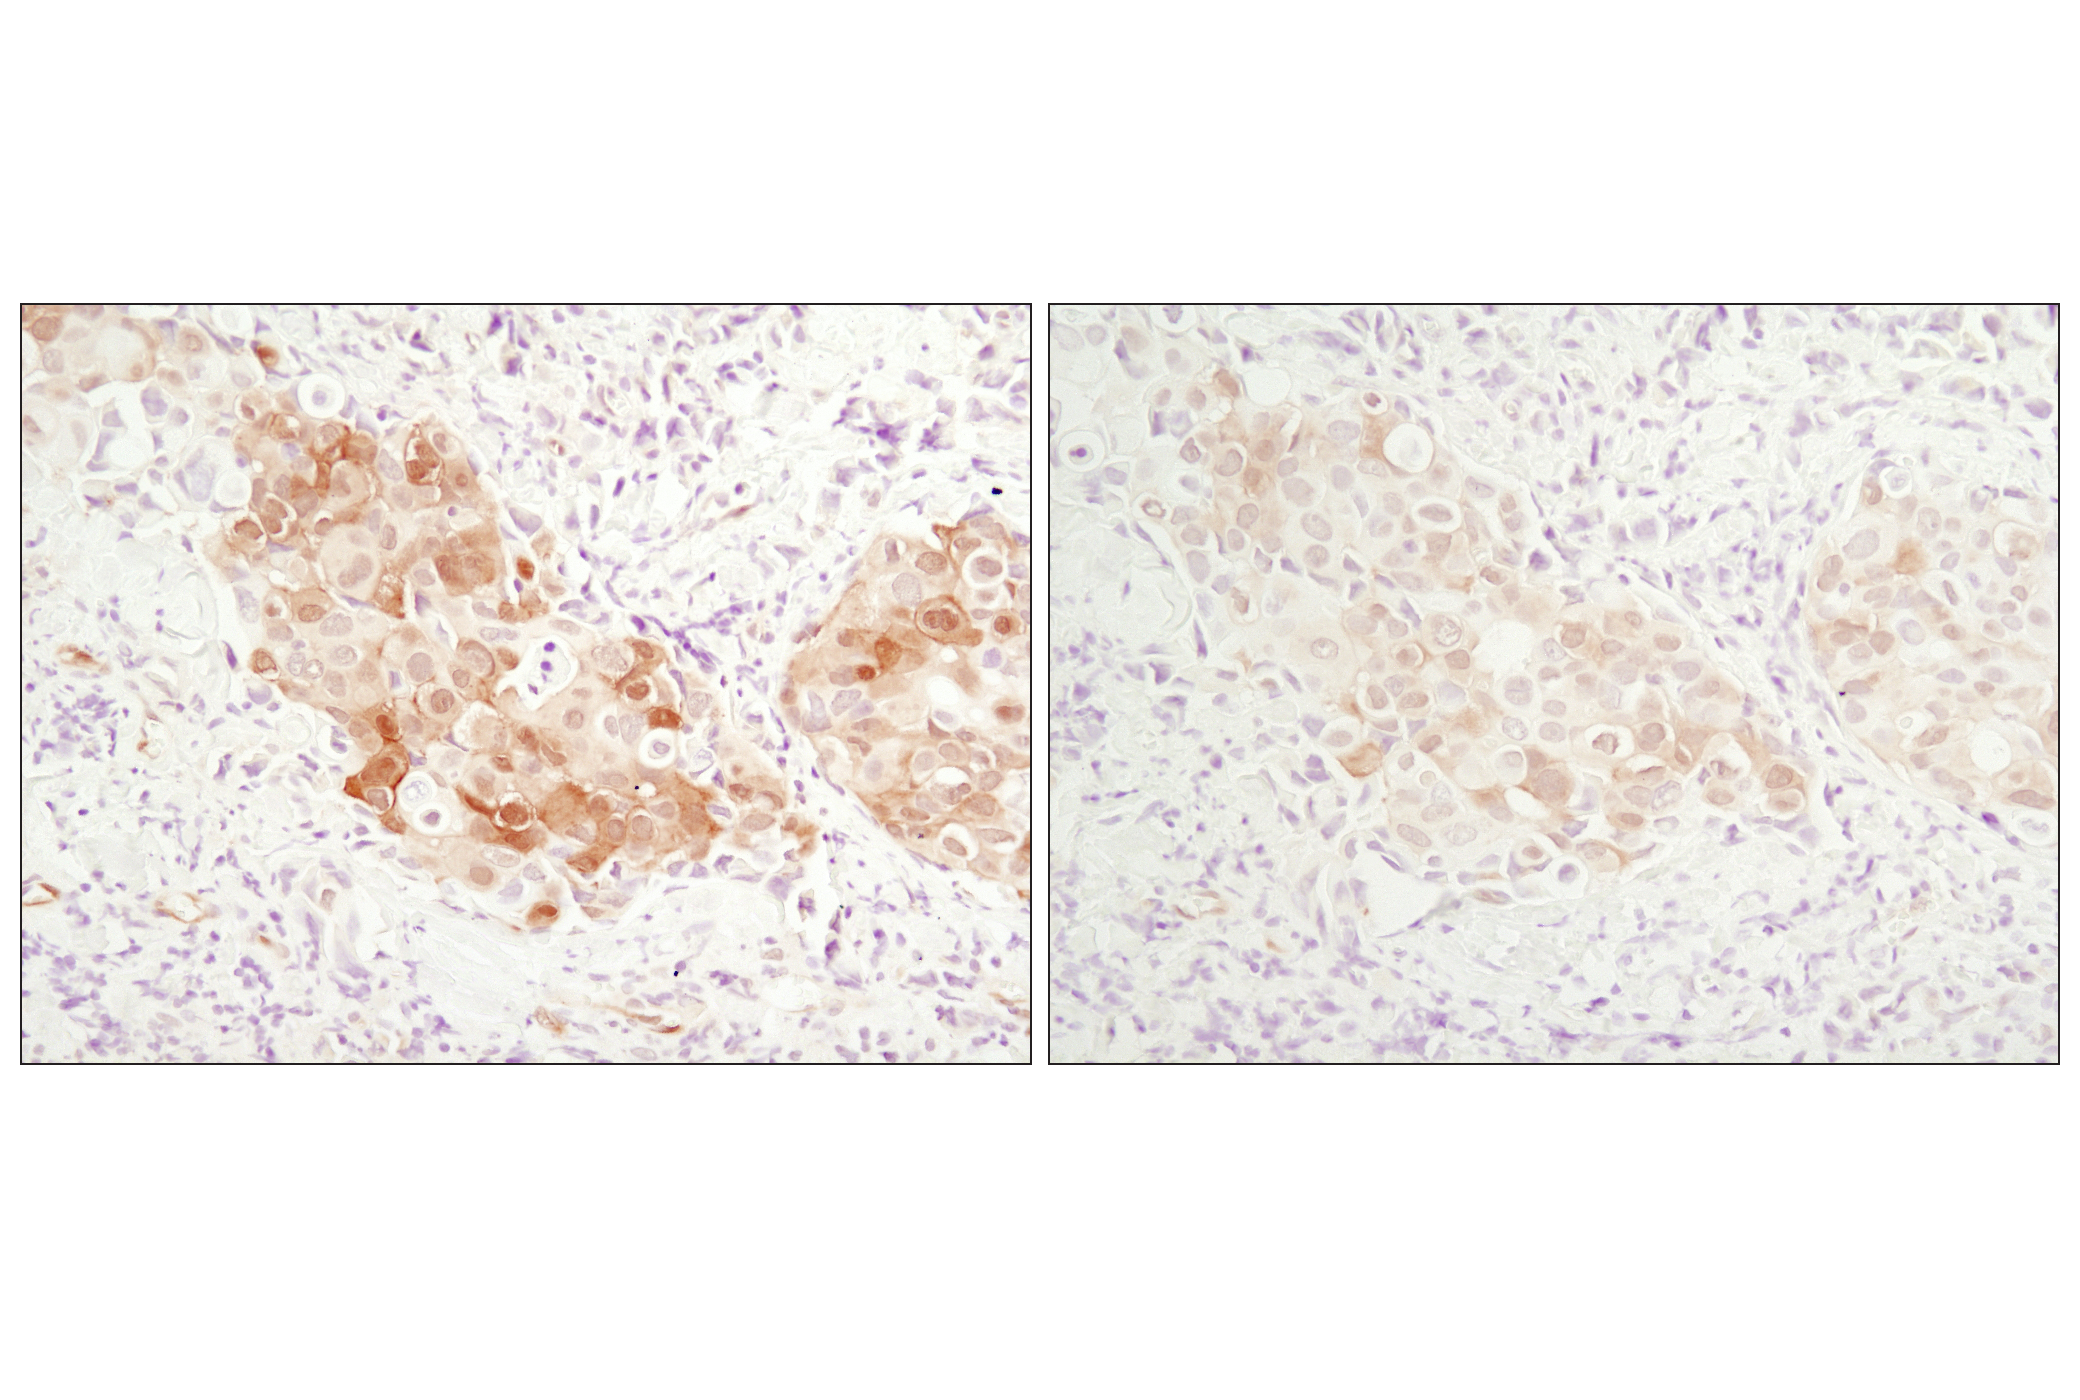
Akt, also referred to as PKB or Rac, plays a critical role in controlling survival and apoptosis (9-11). This protein kinase is activated by insulin and various growth and survival factors to function in a wortmannin-sensitive pathway involving PI3 kinase (10,11). Akt is activated by phospholipid binding and activation loop phosphorylation at Thr308 by PDK1 (12) and by phosphorylation within the carboxy terminus at Ser473. The previously elusive PDK2 responsible for phosphorylation of Akt at Ser473 has been identified as mammalian target of rapamycin (mTOR) in a rapamycin-insensitive complex with rictor and Sin1 (13,14).
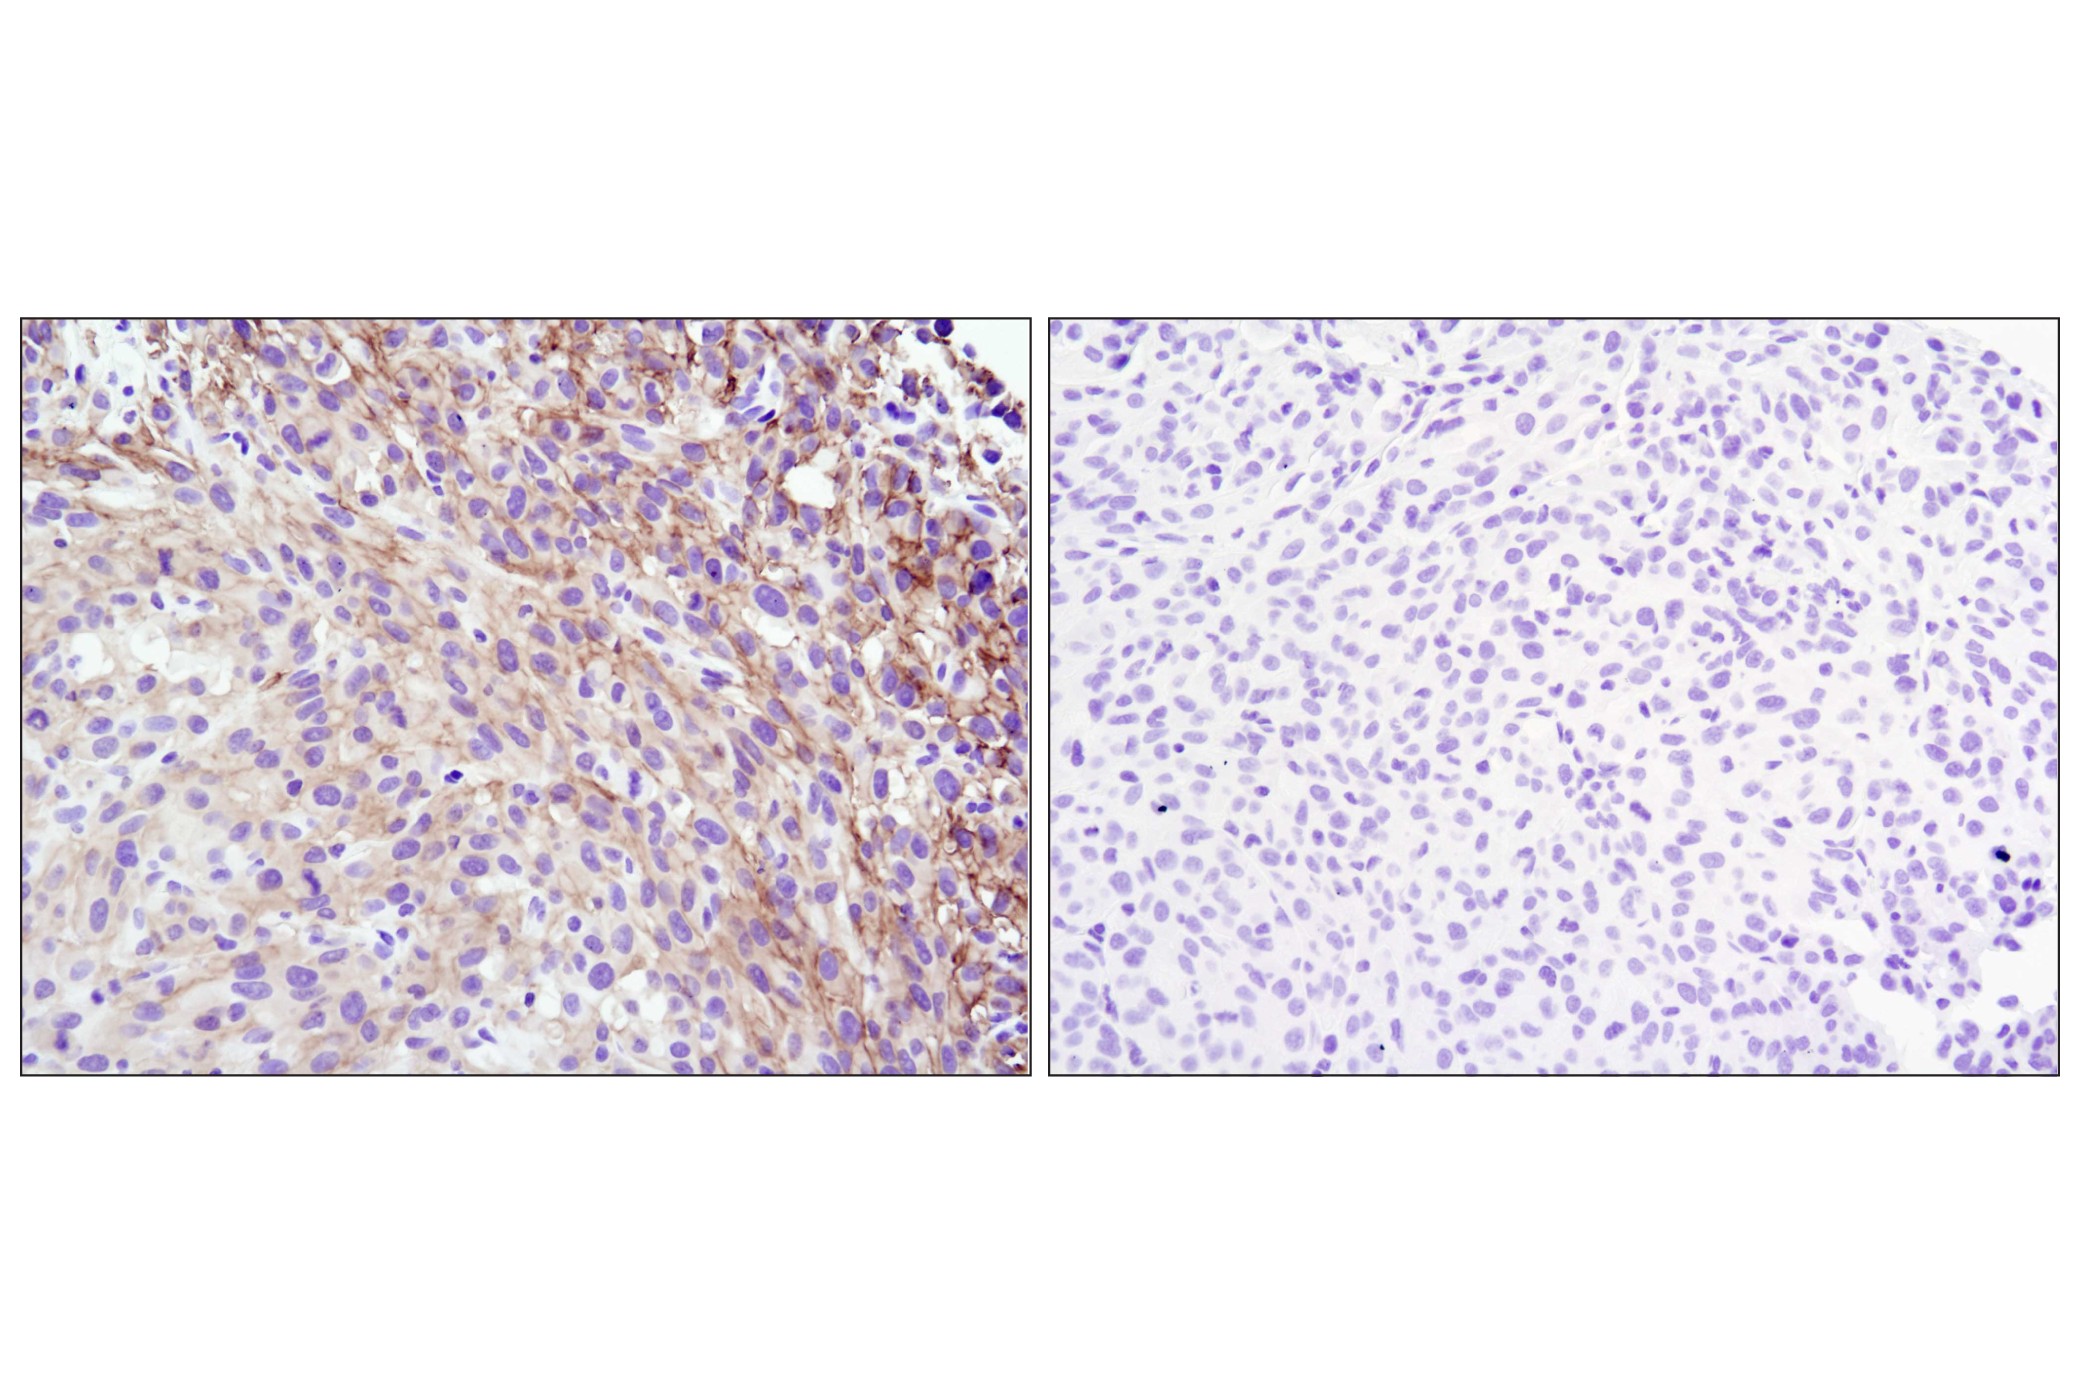
Tuberin is a product of the TSC2 tumor suppressor gene and an important regulator of cell proliferation and tumor development (15). Tuberin is phosphorylated on Ser939 and Thr1462 in response to PI3K activation and the human TSC complex is a direct biochemical target of the PI3K/Akt pathway (16). This result complements Drosophila genetics studies suggesting the possible involvement of the tuberin-hamartin complex in the PI3K/Akt mediated insulin pathway (17-19).
The mammalian target of rapamycin (mTOR, FRAP, RAFT) is a Ser/Thr protein kinase (20-22) that functions as an ATP and amino acid sensor to balance nutrient availability and cell growth (23,24). When sufficient nutrients are available, mTOR responds to a phosphatidic acid-mediated signal to transmit a positive signal to p70 S6 kinase and participate in the inactivation of the eIF4E inhibitor, 4E-BP1 (25). These events result in the translation of specific mRNA subpopulations. mTOR is phosphorylated at Ser2448 via the PI3 kinase/Akt signaling pathway and autophosphorylated at Ser2481 (26,27).
The Forkhead family of transcription factors is involved in tumorigenesis of rhabdomyosarcoma and acute leukemias (28-30). Within the family, three members (FoxO1, FoxO4, and FoxO3a) have sequence similarity to the nematode orthologue DAF-16, which mediates signaling via a pathway involving IGFR1, PI3K, and Akt (31-33). Active forkhead members act as tumor suppressors by promoting cell cycle arrest and apoptosis. Increased proliferation results when forkhead transcription factors are inactivated through phosphorylation by Akt at Thr24, Ser256, and Ser319, which results in nuclear export and inhibition of transcription factor activity (34).
Glycogen synthase kinase-3 (GSK-3) was initially identified as an enzyme that regulates glycogen synthesis in response to insulin (35). GSK-3 is a critical downstream element of the PI3K/Akt cell survival pathway whose activity can be inhibited by Akt-mediated phosphorylation at Ser21 of GSK-3α and Ser9 of GSK-3β (36,37).
- Adams, T.E. et al. (2000) Cell Mol Life Sci 57, 1050-93.
- Baserga, R. (2000) Oncogene 19, 5574-81.
- Scheidegger, K.J. et al. (2000) J Biol Chem 275, 38921-8.
- Hernández-Sánchez, C. et al. (1995) J Biol Chem 270, 29176-81.
- Lopaczynski, W. et al. (2000) Biochem Biophys Res Commun 279, 955-60.
- Baserga, R. (1999) Exp Cell Res 253, 1-6.
- White, M.F. et al. (1985) J Biol Chem 260, 9470-8.
- White, M.F. et al. (1988) J Biol Chem 263, 2969-80.
- Franke, T.F. et al. (1997) Cell 88, 435-7.
- Burgering, B.M. and Coffer, P.J. (1995) Nature 376, 599-602.
- Franke, T.F. et al. (1995) Cell 81, 727-36.
- Alessi, D.R. et al. (1996) EMBO J 15, 6541-51.
- Sarbassov, D.D. et al. (2005) Science 307, 1098-101.
- Jacinto, E. et al. (2006) Cell 127, 125-37.
- Soucek, T. et al. (1998) Proc Natl Acad Sci U S A 95, 15653-8.
- Manning, B.D. et al. (2002) Mol Cell 10, 151-62.
- Gao, X. and Pan, D. (2001) Genes Dev 15, 1383-92.
- Potter, C.J. et al. (2001) Cell 105, 357-68.
- Tapon, N. et al. (2001) Cell 105, 345-55.
- Sabers, C.J. et al. (1995) J Biol Chem 270, 815-22.
- Brown, E.J. et al. (1994) Nature 369, 756-8.
- Sabatini, D.M. et al. (1994) Cell 78, 35-43.
- Gingras, A.C. et al. (2001) Genes Dev 15, 807-26.
- Dennis, P.B. et al. (2001) Science 294, 1102-5.
- Fang, Y. et al. (2001) Science 294, 1942-5.
- Navé, B.T. et al. (1999) Biochem J 344 Pt 2, 427-31.
- Peterson, R.T. et al. (2000) J Biol Chem 275, 7416-23.
- Anderson, M.J. et al. (1998) Genomics 47, 187-99.
- Galili, N. et al. (1993) Nat Genet 5, 230-5.
- Borkhardt, A. et al. (1997) Oncogene 14, 195-202.
- Nakae, J. et al. (1999) J Biol Chem 274, 15982-5.
- Rena, G. et al. (1999) J Biol Chem 274, 17179-83.
- Guo, S. et al. (1999) J Biol Chem 274, 17184-92.
- Arden, K.C. (2004) Mol Cell 14, 416-8.
- Welsh, G.I. et al. (1996) Trends Cell Biol 6, 274-9.
- Srivastava, A.K. and Pandey, S.K. (1998) Mol Cell Biochem 182, 135-41.
- Cross, D.A. et al. Nature 378, 785-9.
Background References
Trademarks and Patents
使用に関する制限
法的な権限を与えられたCSTの担当者が署名した書面によって別途明示的に合意された場合を除き、 CST、その関連会社または代理店が提供する製品には以下の条件が適用されます。お客様が定める条件でここに定められた条件に含まれるものを超えるもの、 または、ここに定められた条件と異なるものは、法的な権限を与えられたCSTの担当者が別途書面にて受諾した場合を除き、拒絶され、 いかなる効力も効果も有しません。
研究専用 (For Research Use Only) またはこれに類似する表示がされた製品は、 いかなる目的についても FDA または外国もしくは国内のその他の規制機関により承認、認可または許可を受けていません。 お客様は製品を診断もしくは治療目的で使用してはならず、また、製品に表示された内容に違反する方法で使用してはなりません。 CST が販売または使用許諾する製品は、エンドユーザーであるお客様に対し、使途を研究および開発のみに限定して提供されるものです。 診断、予防もしくは治療目的で製品を使用することまたは製品を再販売 (単独であるか他の製品等の一部であるかを問いません) もしくはその他の商業的利用の目的で購入することについては、CST から別途許諾を得る必要があります。 お客様は以下の事項を遵守しなければなりません。(a) CST の製品 (単独であるか他の資材と一緒であるかを問いません) を販売、使用許諾、貸与、寄付もしくはその他の態様で第三者に譲渡したり使用させたりしてはなりません。また、商用の製品を製造するために CST の製品を使用してはなりません。(b) 複製、改変、リバースエンジニアリング、逆コンパイル、 分解または他の方法により製品の構造または技術を解明しようとしてはなりません。また、 CST の製品またはサービスと競合する製品またはサービスを開発する目的で CST の製品を使用してはなりません。(c) CST の製品の商標、商号、ロゴ、特許または著作権に関する通知または表示を除去したり改変したりしてはなりません。(d) CST の製品をCST 製品販売条件(CST’s Product Terms of Sale) および該当する書面のみに従って使用しなければなりません。(e) CST の製品に関連してお客様が使用する第三者の製品またはサービスに関する使用許諾条件、 サービス提供条件またはこれに類する合意事項を遵守しなければなりません。